

Introduction: Animated Op Art With Complex Numbers


Use complex numbers to generate colorful animations.
In this instructable, we'll see how to use "domain coloring" to represent complex numbers, then tinker with complex functions in the MathVue tool to generate op art animations.
There are almost no formulas nor code shown in this instructable, but you can find the code in the links provided in "Step 6: References".
If you already know about domain coloring, or are strongly allergic to complex numbers, just jump to "Step 4: Towards Op Art".
Step 1: Coloring the Angle

A complex number, z, is usually expressed in the form x + y*i, where x and y are the real and imaginary parts, respectively. It can also be expressed in polar coordinates [angle, radius], where x = radius * cos(angle) and y = radius * sin(angle).
One way of representing complex numbers is the so-called "domain coloring", where:
- The angle gets mapped onto a "hue" value in color space. The hue can be seen as a pigment value.
- The radius is used to define the color brightness, which we will show in the next step.
How is the color defined?
- The animation, "angle-beam", shows a sweep of the angle, with corresponding hue as rotating segment.
- The image, "angle-disc", represents the hues of any point inside the unit circle (points where the radius is 1 or smaller).
___
Notes:
- For references, see [DOMAIN-COLORING] in the last step.
- The tool used is Processing, see links to source code in the last step.
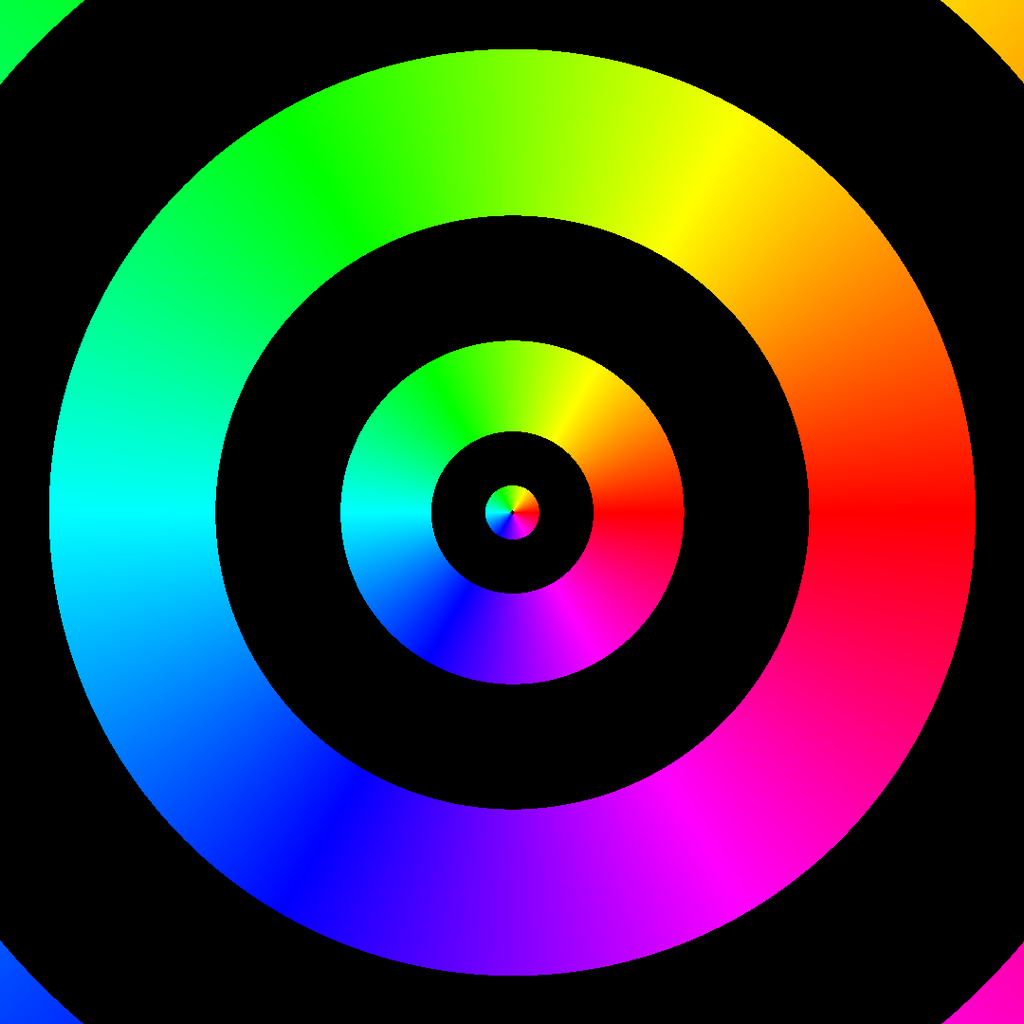
Step 2: Shading the Radius


To represent the radius, we alter the color's brightness (aka "value") according to the radius.
- In the fist image, the color is repeatedly darkened by a modulus of the radius. The period is increasing, giving a logarithmic scale. For the unity function f(z) = z, we get an outward shading.
- As shown in the second image, we can also add angle markers, in the form of light rays. We obtain a polar grid.
This is a qualitative (rather than quantitative) view. However it can visually convey interesting information:
- In the third image, the function f(z) = 1/z has a decreasing radius: when z's radius is smaller, f(z)'s radius is bigger. We can distinguish this from the two first images, by its inward shading. In its center, the radius is infinite; this is called a pole.
___
Notes:
- For references, see [GRID] in the last step.
Step 3: Showing Functions

So far we mainly saw the unity function, now let's try some transforms.
- Movie: We see the unity function f(z) = z, and the inverse function f(z) = 1/z move and collide over time. The inverse function has a narrower influence, but its pole literally slices the unity function.
- Picture: The function f(z) = (z2 - 1) (z - 2 - i)2 / (z2 + 2 + 2i) as seen in the Wikipedia article.
Such views are useful in engineering, when studying mathematical transforms that model physical phenomena.
___
Notes:
- For references, see [FUNCTIONS] in the last step.
Step 4: Towards Op Art
As stated in the intro, the goal is to make some op art, and not engineering.
So, now armed with math tools, let's tweak and tinker, in order to get visually pleasing results.
- Let's take the function f(z) = z / t.
- Let's strongly tune the brightness versus the radius, to obtain black zones.
- Let's tweak the time to obtain a back-and-forth travel, with a strong "warp" effect.
It's a bit less "clinical" than in the previous step. A good start.
___
Notes:
- For references, see [OP-ART-EXPLORATION] in the last step.
Step 5: Final Results
After many trials and tweaks, I found an interesting effect with a term based on the conjugate of z.
- The formula is:
f(z) = z / cyclic_time + (1-cyclic_time) conjugate(z) / z
- This is using MathVue, allowing to compute animated contour plots in your web browser. This tool is rudimentary and not yet completely finished (being a personal side project), but allows to easily get nice results.
- You can see some of my MathVue projects on my Instagram profile.
Thank you for reading.
___
Notes:
- For references, see [FINAL] in the last step.
Step 6: References
[DOMAIN-COLORING]
- Wikipedia article about domain coloring: https://en.wikipedia.org/wiki/Domain_coloring
- Wikipedia article about hue: https://en.wikipedia.org/wiki/Hue
- Tools and source code:
- The Processing tool: https://processing.org/
- "angle-beam" animation sketch: https://www.dropbox.com/sh/sy8xk2m7ntqflq1/AABR1JX...
- "angle-disc" image sketch: https://www.dropbox.com/sh/b8vdd2q8wmf0jdh/AAD3yYa...
[GRID]
- MathVue of radius shading for f(z) = z: https://www.mathvue.com/?complex-ible-2a-radius-v...
- MathVue of grid shading for f(z) = z: https://www.mathvue.com/?complex-ible-2b-radius-gr...
- Mathvue of grid shading for f(1/z) = z: https://www.mathvue.com/?complex-ible-2c-radius-gr...
[FUNCTIONS]
- MathVue of functions collision f(z) = z versus f(z) = 1/z: https://www.mathvue.com/?complex-ible-3a-collision...
[OP-ART-EXPLORATION]
[FINAL]

Participated in the
Colors of the Rainbow Contest


