Introduction: WHY VOTING MATTERS!


This presentation (available as a Power Point or a series of PDF pages) consists of 21 slides which explain US voting eligibility and show - in simple, graphic terms - the percentage of eligible voters who didn't vote in the last national election. Suitable for children in middle school and older and adults of all ages. Comments welcome!
Step 1:

Figures on the total US Population.
Step 2:

10 outline figures which represent the total US population.
Participants may print the row of figures and color them in as the presentation progresses. Templates are included for the row of ten figures (Step 21) or for the single figure (Step 22).
Step 3:

Not everyone can vote....
Step 4:

So who can't vote?
Step 5:

People under 18 years of age can't vote. The approximate number is equal to 2/10ths of the country or 2 figures.
Step 6:

Who are the people that are over 18 in the US population that can't vote. There are three categories.
Step 7:

Group 1. People in the prison system aren't allowed to vote. Depending on the state, these are people who are in jail or people who haven't finished the terms of their sentence.
Step 8:

Group 2. People judged "Mentally Incompetent" (definitions vary from location to location here) aren't allowed to vote.
Step 9:

Group 3. Documented immigrants who aren't citizens can't vote.
Step 10:

Adding together the approximate number of people over 18 who fit into these 3 groups ( in the prison system, mentally incompetent, or documented immigrants who aren't citizens ) accounts for 1/10th of the US population - another figure.
Step 11:

So, to review:
Three figures (or 3/10ths of the US population) are ineligible to vote, either because of being underage or because of another status.
What about the remaining 7 figures?
Step 12:
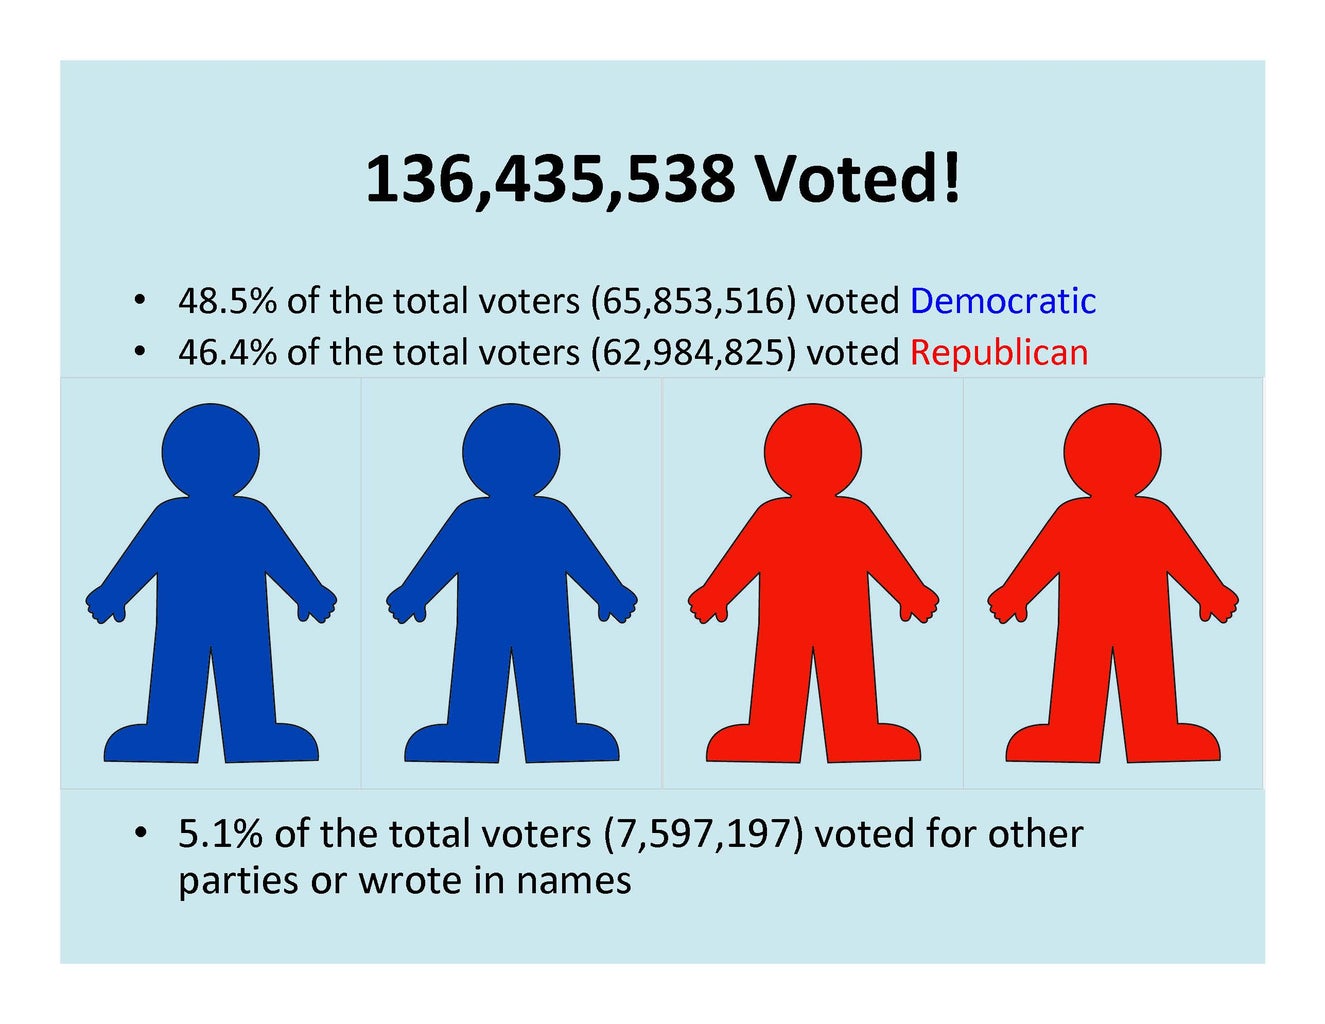
Some of them are voters. Let's look at the people that voted in the last election. That's approximately 136 million people - or 2/5ths of the total US population. About half of that number went for each party.
Step 13:

So let's look at where we are:
Three figures represent people unable to vote
Four figures represented people that voted for one of the two major political parties.
That still leaves three figures. These are the people that are eligible to vote but who sat out the election...
Step 14:

So why didn't those approximately 90 million people vote??
Step 15:

Here are the 8 top reasons people say they don't vote.
Can we think of arguments to address each of these excuses?
Step 16:

So, we ask again. "What Happens When People That Can Vote Don't Vote?
You should be better able to answer that question now.
Step 17:

Nobody should think that their vote doesn't matter. There have been many
elections won by a single, a handful or a few hundred votes!
Step 18:

Just imagine if even one out of those three non-voting figures (about 30 million voters) had voted!
Step 19:

Sources for the statements made in this presentation and resources for further reading.
Step 20: Credits

Please send your comments and suggestions to austin.activism@gmail.com!
Thanks so much for using this lesson on why voting matters!
Step 21: Here Is a Place to Download This Presentation As a Series of PDF Pages.
Attachments

Step 22: Here Is a Place to Download a Power Point Presentation of This Lesson.
Attachments

Step 23: Here Is a Template for the Line of 10 Figures, Representing the Total Population of the US.

Step 24: Here Is a Place to Download a Single Figure, Representing 1/10 of the US Population.