Introduction: Arduino CO Monitor Using MQ-7 Sensor


A few words why this instructable was created: one day my girlfriend's mother phoned us at the middle of the night because she felt really sick - she had dizziness, tachycardia, nausea, high blood pressure, she even fainted for unknown time (probably ~5 minutes, but there is no way to tell), all without any apparent reason. She lives in a small village far away from hospitals (60 km from our place, 30 km to the closest hospital, 10 km without any normal road in between), so we rushed to her and got there soon after the ambulance. She got hospitalized and in the morning she felt almost well, but doctors weren't able to find the cause of it. The next day we had an idea: it could have been CO poisoning, since she has gas water boiler (on the photo), and was sitting close to it for the whole evening when it happened.
We recently bought MQ-7 CO sensor, but never had time to assemble a schematics for it, so this was the perfect time to do so. After an hour of searching internet for any instructions, I realized that I can't find any guide that at the same time follows sensor manufacturer's instructions provided in its datasheet and explains anything at all (one example seemed to have quite good code, but it wasn't clear how to apply it, others were oversimplified and wouldn't work well). So we spent about 12 hours for developing schematics, making and printing 3d case, testing and calibrating the sensor, and the next day went to the suspicious boiler. It turned out that CO levels there were extremely high, and could be fatal if CO exposure time were longer. So I believe anyone who has similar situation (like gas boiler or other combustion happening inside a living space) should get such sensor to prevent something bad from happening.
All that happened two weeks ago, since then I improved schematics and program quite a lot, and now it seems to be reasonably good and relatively simple (not 3-lines-of-code simple, but still). Although I hope that someone with precise CO meter will provide me some feedback on default calibration that I put in the sketch - I suspect it is far from good.
Here is a complete guide with some experimental data.
Step 1: Bill of Materials

You will need:
0. Arduino board. I prefer Chinese clone of Arduino Nano for its outstanding price of $3, but any 8-bit arduino will work here. Sketch uses some advanced timers operation, and was tested only on atmega328 microcontroller - although probably it will work well on others too.
1. MQ-7 CO sensor. Most commonly available with this Flying Fish sensor module, it has to run through a small modification, details in the next step, or you can use a separaten MQ-7sensor.
2. NPN bipolar transistor. Virtually any NPN transistor that can handle 300 mA or more will work here. PNP transistor won't work with a mentioned Flying Fish module (because it has heater pin soldered to sensor's output), but can be used with a discrete MQ-7 sensor.
3. Resistors: 2 x 1k (from 0.5k to 1.2k will work fine), and 1 x 10k (that one is best kept precise - although if you absolutely must use a different value, adjust reference_resistor_kOhm variable in the sketch accordingly).
4. Capacitors: 2 x 10uF or more. Tantalum or ceramic ones are required, electrolytic won't work well due to high ESR (they won't be able to provide enough current to smooth high-current ripple).
5. Green and red LEDs to indicate current CO level (you can also use a single dual-color LED with 3 terminals, as we used in our yellow box prototype).
6. Piezo buzzer to indicate high CO level.
7. Breadboard and wires (you also can solder everything to Nano pins or squeeze into Uno sockets, but it's easy to make a mistake this way).
Step 2: Module Modification or Discrete Sensor Wiring
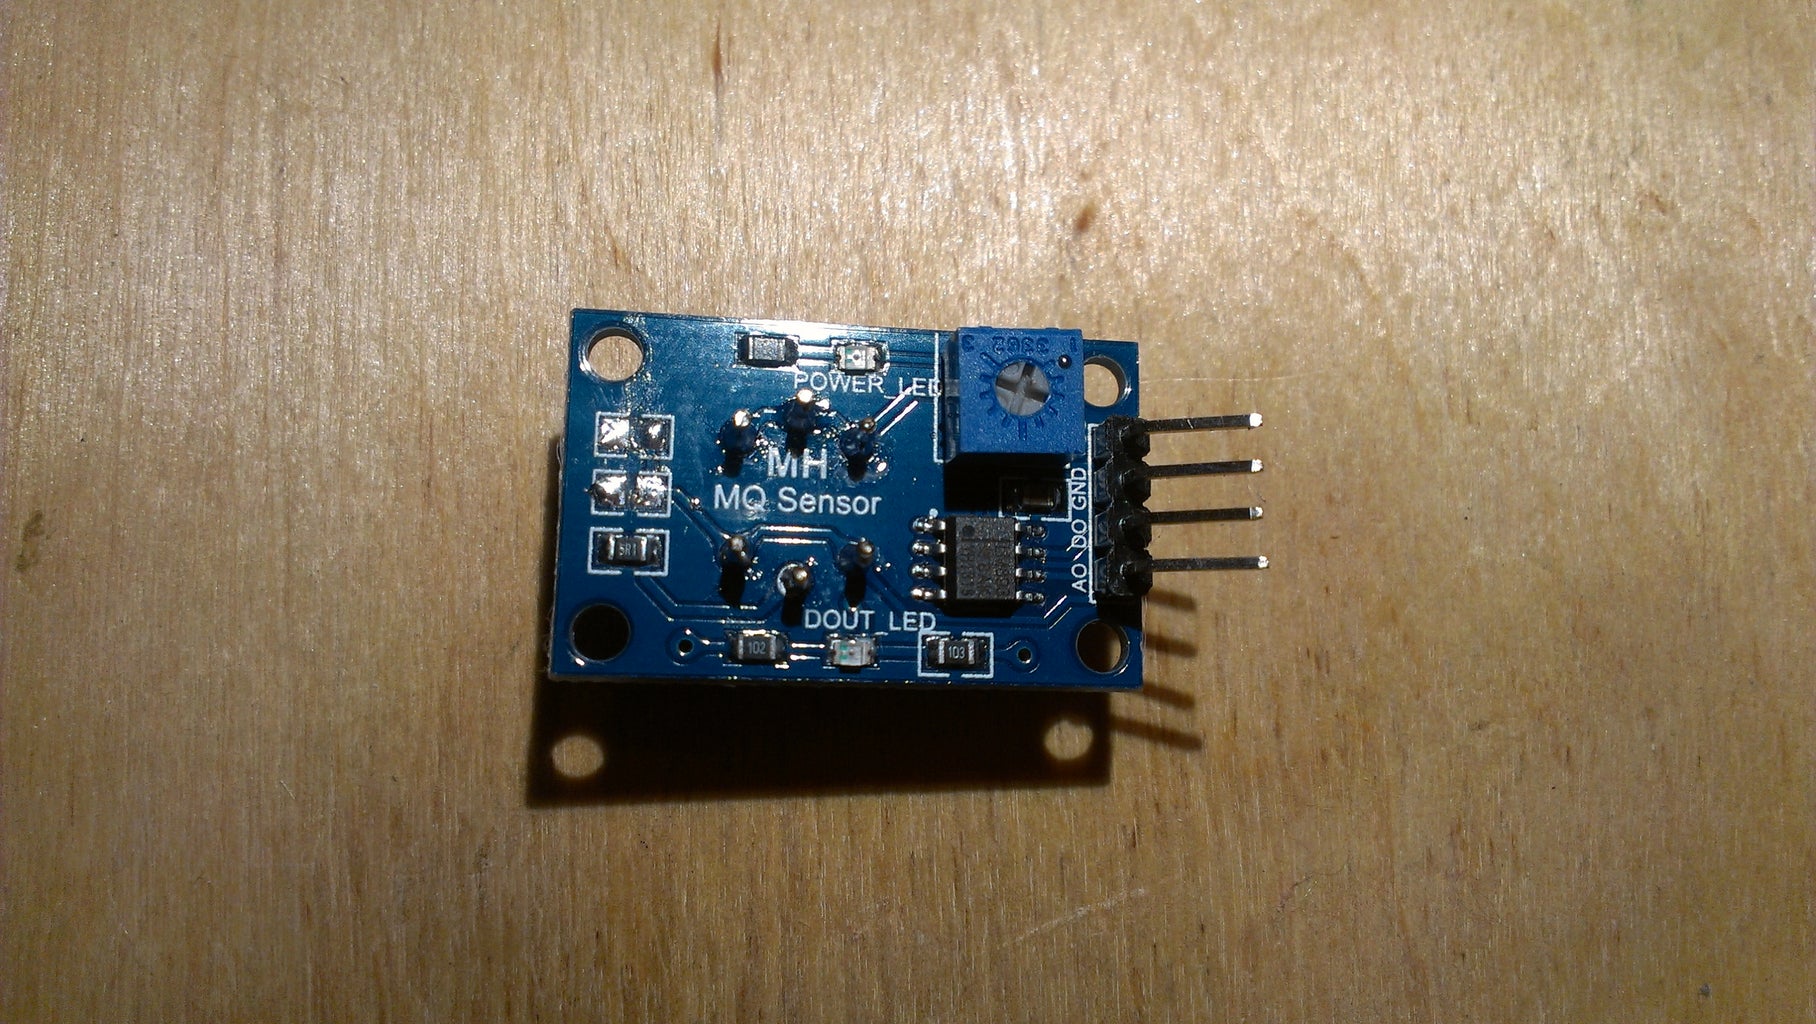
For module, you must desolder resistor and capacitor, as shown on the photo. You can desolder basically everything if you want - module electronics is totally useless, we use it only as holder for the sensor itself, but these two components will prevent you from getting correct readings,
If you are using discrete sensor, attach heater pins (H1 and H2) to 5V and transistor's collector correspondingly. Attach one sensing side (any of A pins) to 5V, another sensing side (any of B pins) to 10k resistor, just like the analog pin of the module in schematics.
Step 3: Operation Principle


Why we need all these complications at all, why not to attach 5V, ground, and just get readings?
Well, you won't get anything useful this way, unfortunately.
According to MQ-7 datasheet, sensor has to run through high- and low-heating cycles in order to get proper measurements. During low temperature phase, CO is absorbed on the plate, producing meaningful data. During high temperature phase, absorbed CO and other compounds evaporate from the sensor plate, cleaning it for the next measurement.
So in general operation is simple:
1. Apply 5V for 60 seconds, don't use these readings for CO measurement.
2. Apply 1.4V for 90 seconds, use these readings for CO measurement.
3. Go to step 1.
But here's the problem: Arduino can't provide enough power to run this sensor from its pins - sensor's heater requires 150 mA, while Arduino pin can provide no more than 40 mA, so if attached directly, Arduino pin will burn and sensor still won't work. So we must use some kind of current amplifier that takes small input current to control large output current.
Another problem is getting 1.4V. The only way to reliably get this value without introducing a lot of analog components is to use PWM (Pulse Width Modulation) approach with feedback that will control output voltage.
NPN transistor solves both problems: when it is constantly turned on, voltage across the sensor is 5V and it is heating for high-temperature phase. When we apply PWM to its input, current is pulsing, then it is smoothed by the capacitor, and the average voltage is kept constant. If we use high frequency PWM (in the sketch it has frequency of 62.5KHz) and average a lot of analog readings (in the sketch we average over ~1000 readings), then the result is quite reliable.
It is critical to add capacitors according to schematics. Images here illustrate difference in signal with and without C2 capacitor: without it, PWM ripple is clearly visible and it significantly distorts readings.
Step 4: Schematics and Breadboard


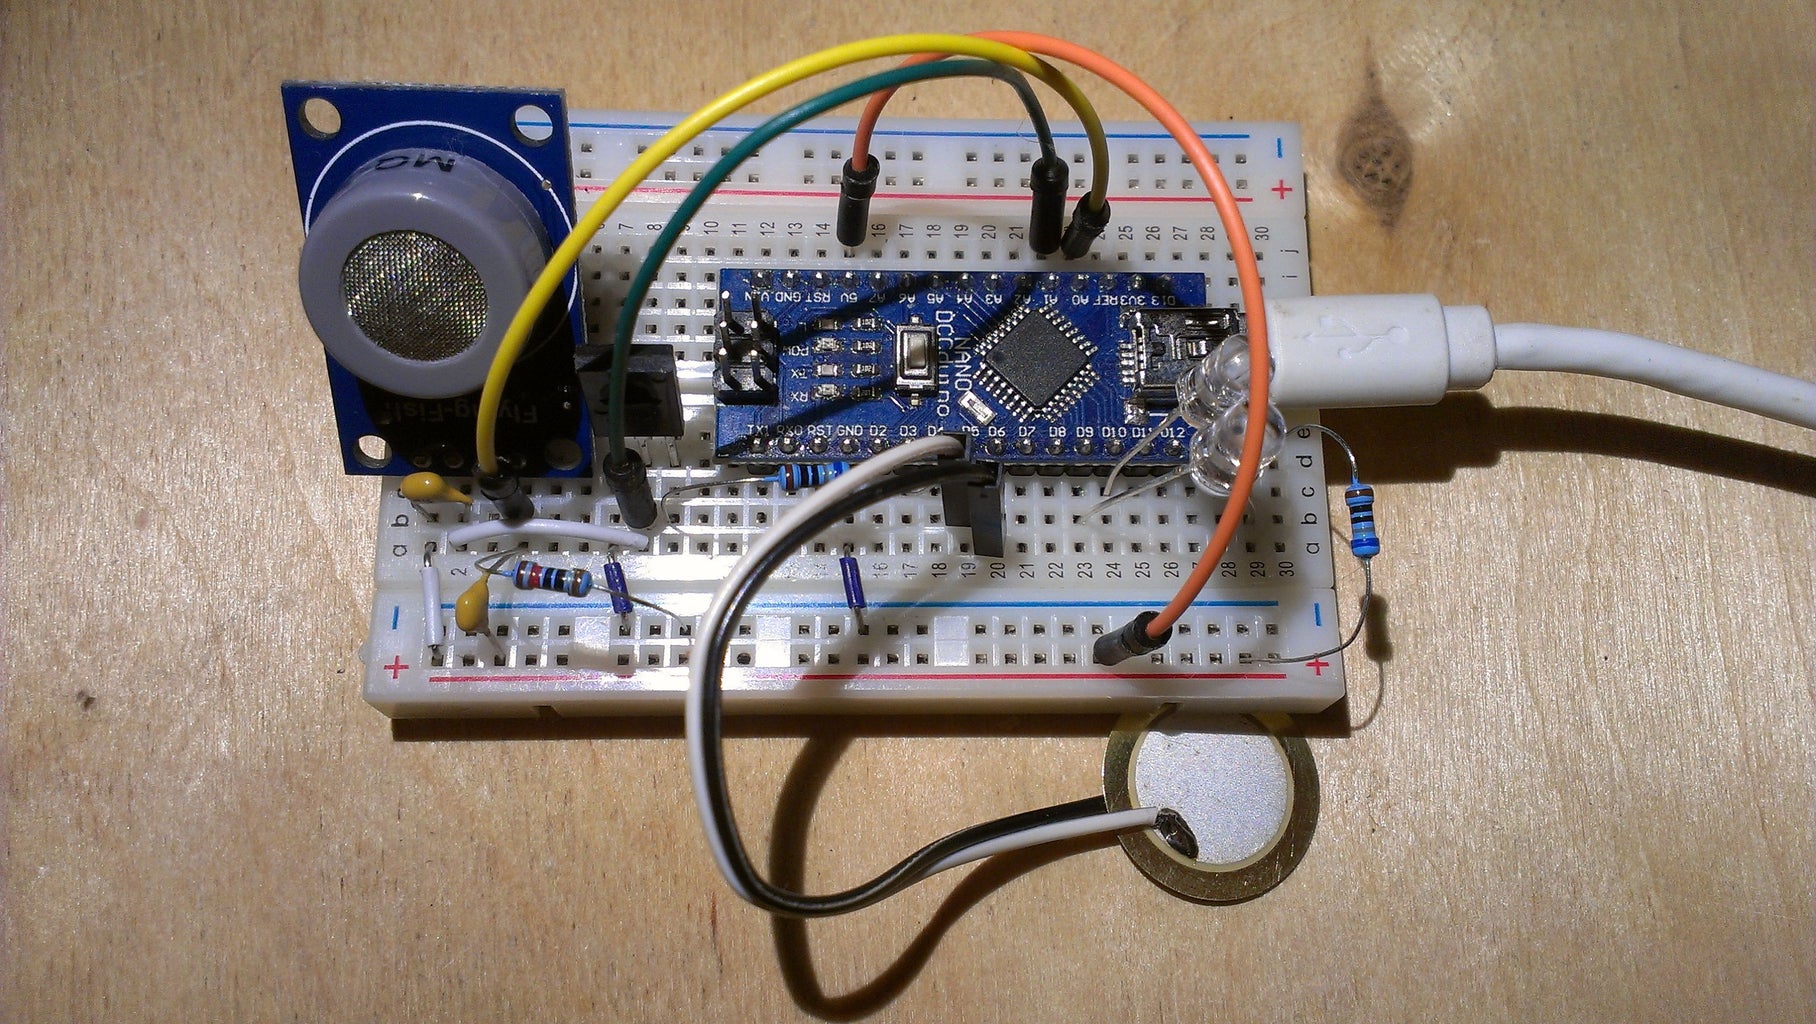
Here is the schematics and breadboard assembly.
WARNING! Modification of a standard breakout module is required! Without modification module is useless. Modification is described in the second step.
It is important to use pins D9 and D10 for LEDs, since there we have outputs of hardware Timer1, it will allow to smoothly change their colors.
Pins D5 and D6 are used for buzzer, because D5 and D6 are outputs of hardware Timer0. We will configure them to be inverse one to another, so they will switch between (5V, 0V) and (0V, 5V) states, thus producing sound on buzzer. Warning: this affects Arduino's main timing interrupt, so all time-dependent functions (like millis() ) won't produce correct results in this sketch (more on this later).
Pin D3 has hardware Timer2 output connected to it (as well as D11 - but it's less convenient to put wire on D11 than on D3) - so we are using it to provide PWM for voltage controlling transistor.
Resistor R1 is used to control brightness of LEDs. It can be anywhere from 300 to 3000 Ohm, 1k is rather optimal in brightness/power consumption.
Resistor R2 is used to limit transistor's base current. It shouldn't be lower than 300 Ohms (to not overload Arduino pin), and not higher than 1500 Ohms. 1k there is a safe choice.
Resistor R3 is used in series with sensor's plate in order to create a voltage divider. Voltage on sensor's output is equal to R3 / (R3 + Rs) * 5V, where Rs is current sensor's resistance. Sensor resistance depends on CO concentration, so voltage changes accordingly.
Capacitor C1 is used to smooth input PWM voltage on MQ-7 sensor, the higher is its capacitance the better, but also it has to have low ESR - so ceramic (or tantalum) capacitor is preferred here, electrolytic one won't perform well.
Capacitor C2 is used to smooth sensor's analog output (output voltage depends on input voltage - and we have quite a high current PWM here, that affects all schematics, so we need C2). The simplest solution is to use the same capacitor as C1.
NPN transistor either conducts current all the time to provide high current on sensor's heater, or works in PWM mode thus reducing heating current.
Step 5: Arduino Program

WARNING: SENSOR REQUIRES MANUAL CALIBRATION FOR ANY PRACTICAL USE. WITHOUT CALIBRATION, DEPENDING ON PARAMETERS OF YOUR PARTICULAR SENSOR, THIS SKETCH MIGHT TURN ON ALARM IN CLEAN AIR OR NOT DETECT LETHAL CARBON MONOXIDE CONCENTRATION.
Calibration is described in the following steps. Rough calibration is very simple, precise is quite complex.
On the general level, program is rather simple:
First we calibrate our PWM in order to produce stable 1.4V required by sensor (proper PWM width depends on a lot of parameters like exact resistor values, this particular sensor's resistance, transistor's VA curve etc etc - so the best way is to try various values and use one that fits best).
Then, we continuously run through cycle of 60 seconds heating and 90 seconds measurement.
In implementation it gets somewhat complicated. We have to use hardware timers because everything that we have here needs high-frequency stable PWM in order to function properly.
The code is attached here and can be downloaded from our github, as well as schematics source in Fritzing.
In the program there are 3 functions that handle timers: setTimer0PWM, setTimer1PWM, setTimer2PWM.
Each of them sets timer in PWM mode with given parameters (commented in the code), and sets pulse width according to input values.
Measurement phases are switched using functions startMeasurementPhase and startHeatingPhase, they handle everything inside. and set proper timer values for switching between 5V and 1.4V heating.
LEDs state is set by function setLEDs which accepts green and red brightness on its input (in linear 1-100 scale) and converts it into corresponding timer setting.
Buzzer state is controlled using functions buzz_on, buzz_off, buzz_beep. On/off functions turn sound on and off, beep function produces specific beeping sequence with period of 1.5 seconds if it is periodically called (this function returns immediately so it doesn't pause the main program - but you have to call it again and again to produce beeping pattern).
Program first runs function pwm_adjust that finds out proper PWM cycle width in order to achieve 1.4V during measurement phase. Then it beeps a few times to indicate that sensor is ready, switches into measurement phase, and starts the main loop.
In the main loop, program checks if we spent enough time in current phase (90 seconds for measurement phase, 60 seconds for heating phase) and if yes, then changes current phase. Also it constantly updates sensor readings using exponential smoothing: new_value = 0.999*old_value + 0.001*new_reading. With such parameters and measuring cycle, it averages signal over approximately last 300 milliseconds.
WARNING: SENSOR REQUIRES MANUAL CALIBRATION FOR ANY PRACTICAL USE. WITHOUT CALIBRATION, DEPENDING ON PARAMETERS OF YOUR PARTICULAR SENSOR, THIS SKETCH MIGHT TURN ON ALARM IN CLEAN AIR OR NOT DETECT LETHAL CARBON MONOXIDE CONCENTRATION.
Attachments

Step 6: First Run: What to Expect

If you assembled everything properly, after running sketch you will see something like this in Serial monitor:
adjusting PWM w=0, V=4.93
...
adjusting PWM w=17, V=3.57
PWM result: width 17, voltage 3.57
and then a series of numbers representing current sensor readings.
This part is adjusting PWM width in order to produce sensor's heater voltage as close to 1.4V as possible, measured voltage is deducted from 5V, so our ideal measured value is 3.6V. If this process never ends or ends after a single step (resulting in width equal to 0 or 254) - then something is wrong. Check if your transistor is really NPN and is properly connected (make sure you used base, collector, emitter pins right - base goes to D3, collector to MQ-7 and emitter to ground, don't count on Fritzing breadboard view - it is wrong for some transistors) and make sure that you connected sensor's input to Arduino's A1 input.
If everything is fine, you should see in Serial Plotter from Arduino IDE something similar to the image. Heating and measurement cycles of 60 and 90 seconds length are running one after another, with CO ppm measured and updated at the end of each cycle. You can take some open flame close to the sensor when measurement cycle is almost finished and see how it will affect readings (depending on flame type, it can produce up to 2000 ppm CO concentration in open air - so even though only a small portion of it actually goes into sensor, it still will turn on the alarm, and it won't go off until the end of the next cycle). I showed it on the image, as well as the response to fire from the lighter.
Step 7: Sensor Calibration


According to manufacturer's datasheet, sensor should be running heating-cooling cycles for 48 hours in a row before it can be calibrated. And you should do it if you intend to use it for a long time: in my case, sensor reading in clean air changed for about 30% over 10 hours. If you won't take this into account, you can get 0 ppm result where there is actually 100 ppm of CO. If you don't want to wait for 48 hours, you can monitor sensor output at the end of measurement cycle. When over an hour it won't change for more than 1-2 points - you can stop heating there.
Rough calibration:
After running sketch for at least 10 hours in clean air, take raw sensor value in the end of the measurement cycle, 2-3 seconds before heating phase starts, and write it into sensor_reading_clean_air variable (line 100). That's it. Program will estimate other sensor parameters, they won't be precise, but should be enough to distinguish between 10 and 100 ppm concentration.
Precise calibration:
I highly recommend to find a calibrated CO meter, make 100 ppm CO sample (this can be done by taking some flue gas into syringe - CO concentration there can easily be in the range of several thousands ppm - and slowly putting it into closed jar with calibrated meter and MQ-7 sensor), take raw sensor reading at this concentration and put it into sensor_reading_100_ppm_CO variable. Without this step, your ppm measurement can be wrong several times in either direction (still ok if you need alarm for dangerous CO concentration at home, where normally there should be no CO at all, but not good for any industrial application).
As I didn't have any CO meter, I used a more sophisticated approach. First I prepared high concentration of CO using combustion in isolated volume (first photo). In this paper I found the most useful data, including CO yield for different flame types - it isn't in the photo, but the final experiment used propane gas combustion, with the same setup, resulting in ~5000 ppm CO concentration. Then it was diluted 1:50 in order to achieve 100 ppm, as illustrated in the second photo, and used to determine sensor's reference point.
Step 8: Some Experimental Data

In my case, sensor worked quite well - it is not very sensitive for really low concentrations, but good enough for detecting anything higher than 50ppm. I tried to increase concentration gradually, taking measurements, and built a set of charts. There are two sets of 0ppm lines - pure green before CO exposure and yellow green after. Sensor seems to slightly change its clean air resistance after exposure, but this effect is small. It doesn't seem to be able to clearly distinguish between 8 and 15, 15 and 26, 26 and 45 ppm concentrations - but the trend is very clear, so it can tell whether concentration is in 0-20 or 40-60 ppm range. For higher concentrations dependence is much more distinctive - when exposed to exhaust of an open flame, curve goes up from the start without going down at all, and its dynamics is totally different. So for high concentrations there is no doubt that it works reliably, although I can't confirm its precision since I don't have any rated CO meter.
Also, this set of experiments was done using 20k load resistor - and after that I decided to recommend 10k as the default value, it should be more sensitive this way.
That's it. If you have a reliable CO meter and will have assembled this board, please share some feedback about sensor precision - it would be great to collect statistics over various sensors and improve default sketch assumptions.