

Introduction: Arduino Frequency Detection


As a follow up to the Arduino Audio Input tutorial that I posted last week, I wrote a sketch which analyzes a signal coming into the Arduino's analog input and determines the frequency. The code uses a sampling rate of 38.5kHz and is generalized for arbitrary waveshapes. I've also turned the LED attached to pin 13 into a clipping indicator, so you know if you need to adjust your signal's amplitude as you send it into the Arduino.
Some project ideas for the code presented here include:
pitch reactive projects- change the color of RGB LEDs with pitch, or make a lock that only opens when you sing a certain pitch or melody
audio to MIDI conversion- get the Arduino to translate an incoming signal into a series of MIDI messages. See my instructable about getting the Arduino to send and receive MIDI for lots of example code to get started
audio effects- use the frequency information to reconstruct an audio signal from the tone() library or with some stored samples to make a cool effects box/synthesizer
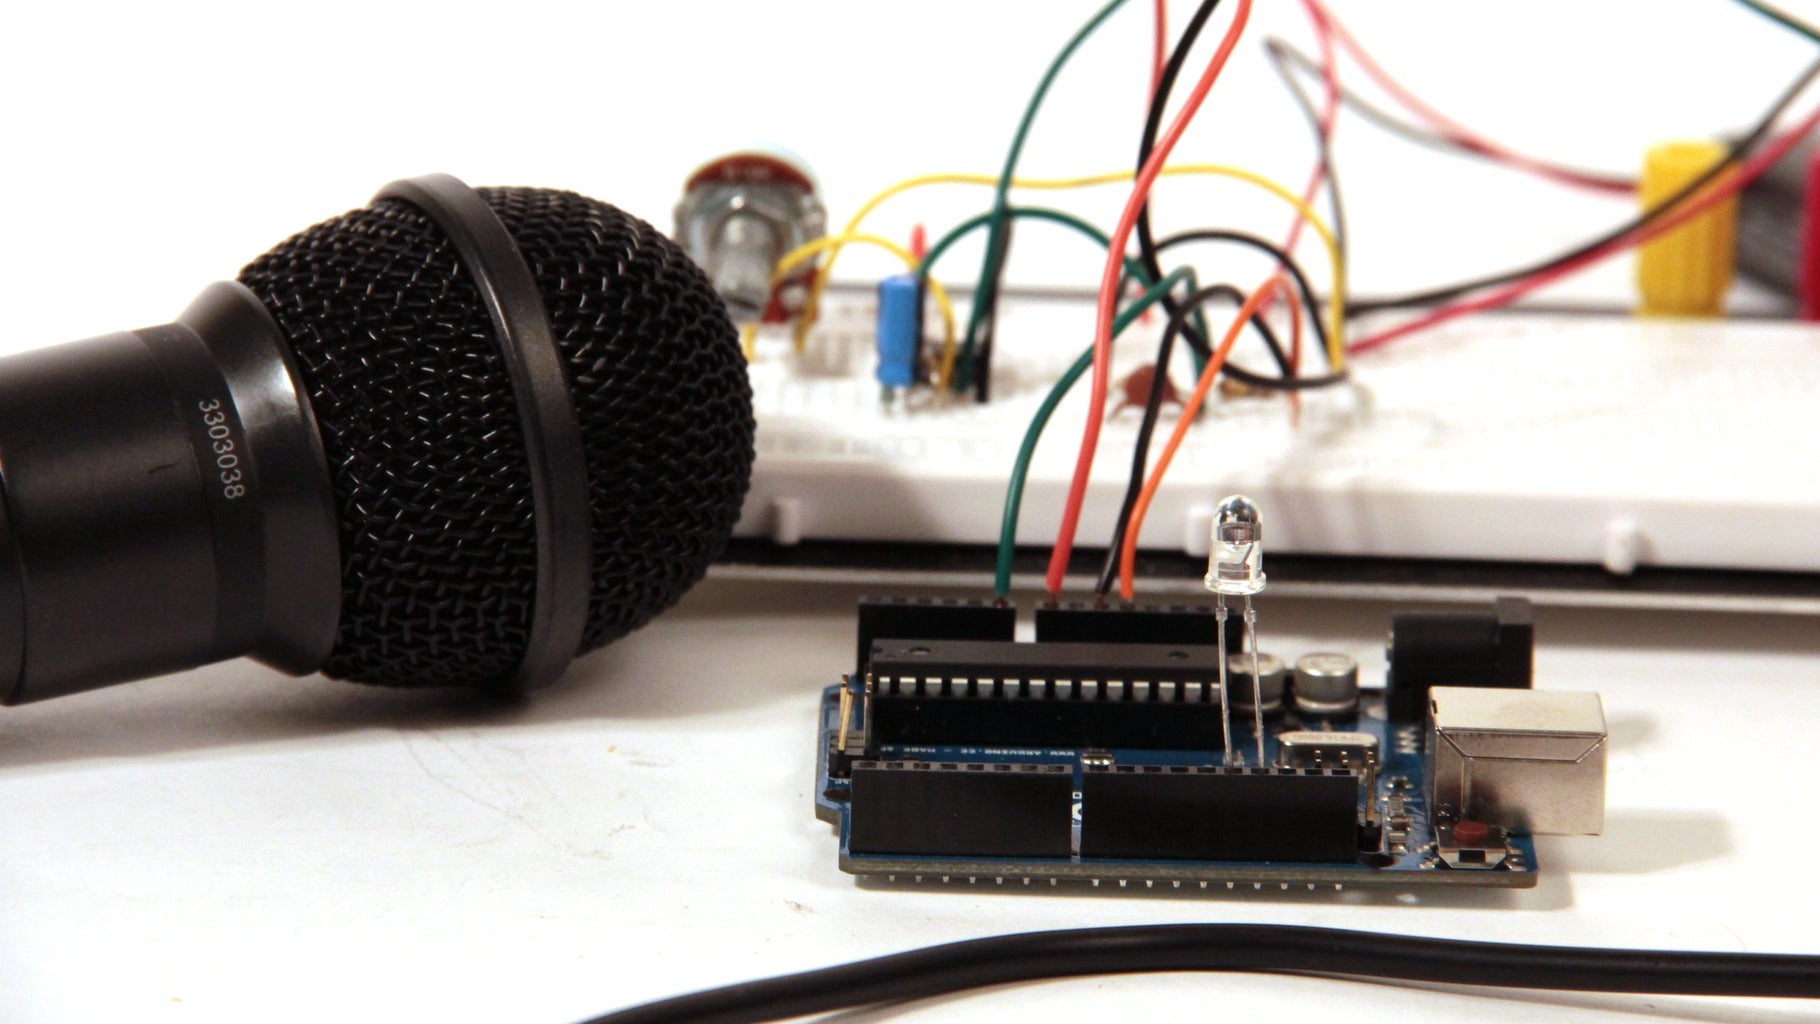
The first step of this project is to set up the audio input circuit. I wrote a detailed Instructable about that here.
Step 1: Detection of Signal Slope


The important portion of the code is reproduced below. All of this code takes place in the ADC interrupt (interrupts and runs each time a new analog in value is ready from A0, more info about what interrupts are and why we use them can be found here)
prevData = newData;//store previous value
newData = ADCH;//get value from A0
if (newData > prevData){//if positive slope
PORTB |= B00010000;//set pin 12 high
}
else if (newData < prevData){if negative slope
PORTB &= B11101111;//set pin 12 low
}
I should note here that in this tutorial I use direct port manipulation to turn off and on the output pin (pin 12) of the Arduino. I did this because port manipulation is a much faster way of addressing the Arduino's pins than the digitalWrite() command. Since I had to put all the code above inside an interrupt routine that was going off at 38.5kHz, I needed the code to be as efficient as possible. You can read more about port manipulation on the Arduino website, or see the comments I've written above to understand what each line does. You'll also notice in the code below that I used some unfamiliar commands in the setup() function so that I could get the Arduino's analog input to sample at a high frequency. More info on that can be found in my Arduino Audio Input tutorial.
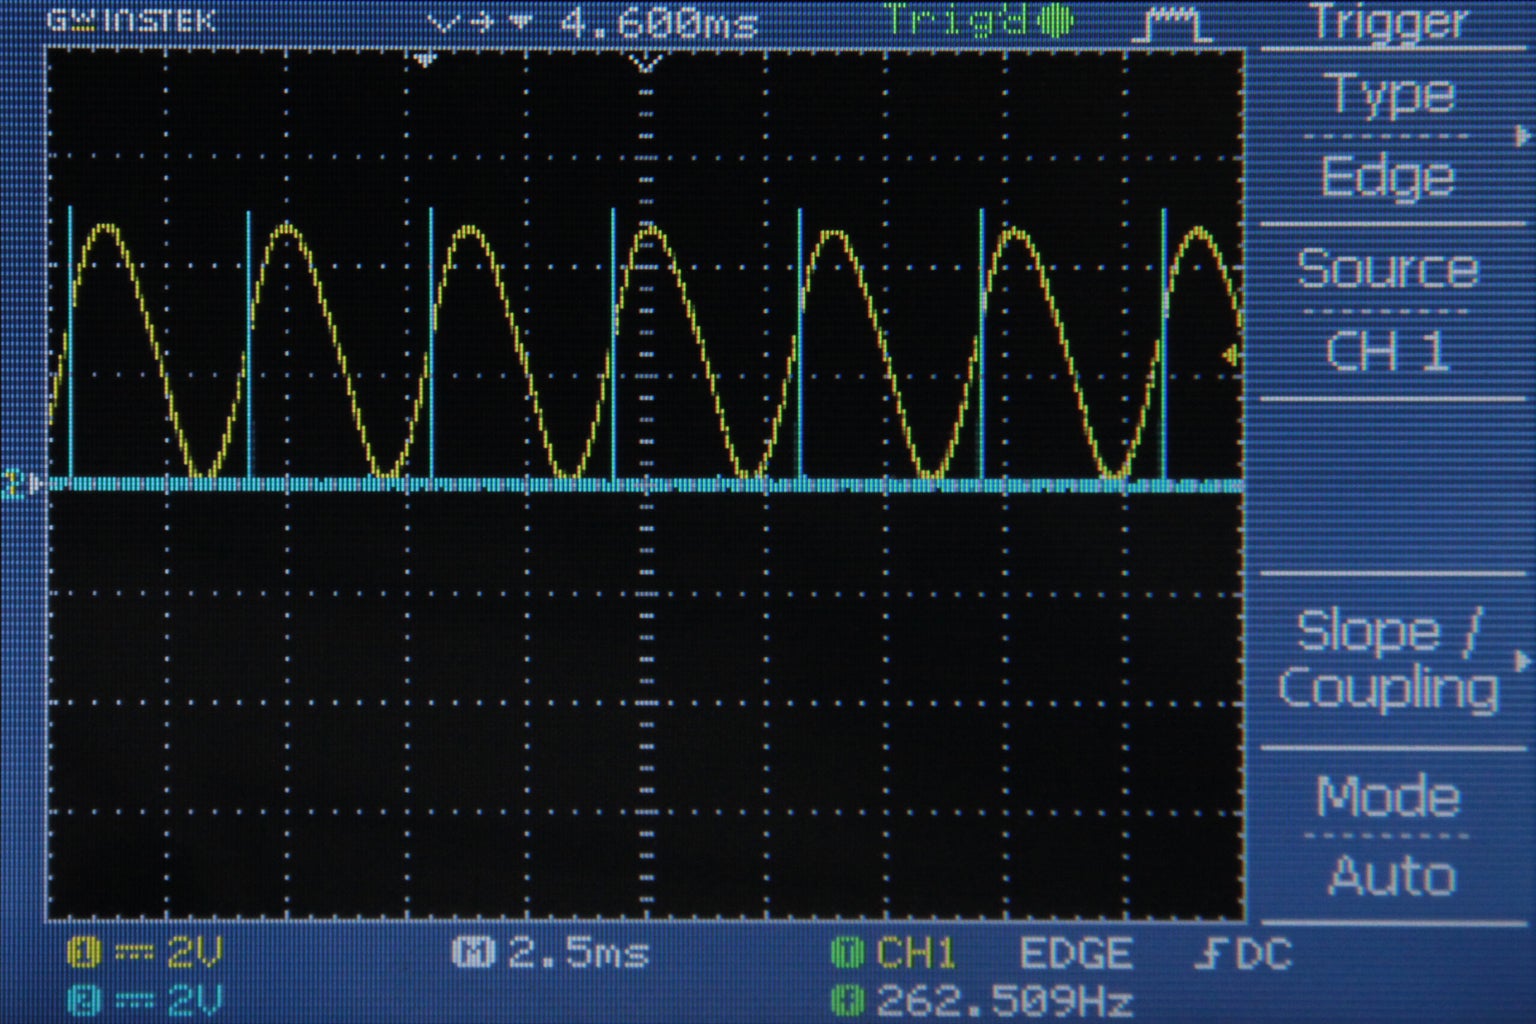
Fig 1 shows the pulse output in blue and the sine wave in yellow on an oscilloscope. Notice how the pulse output toggles each time the sine wave reaches a maximum or minimum. Fig 2 shows the pulse output in blue for an arbitrary waveshape in yellow. Notice here how pulse wave takes on an irregular duty cycle because the incoming signal (yellow) is much more complicated than a sine wave.
Step 2: Mid Point Detection


The important changes to the code are reproduced below. Since I am measuring the incoming signal from A0 with 8 bit precision (0-255), the midpoint (2.5V) will give a value of 127. All of the following code takes place in the ADC interrupt (interrupts each time a new analog in value is ready from A0)
prevData = newData;//store previous value
newData = ADCH;//get value from A0
if (prevData < 127 && newData >= 127){//if increasing and crossing midpoint
PORTB |= B00010000;//set pin 12 high
}
else if (prevData > 127 && newData <= 127){//if decreasing and crossing midpoint
PORTB &= B11101111;//set pin 12 low
}
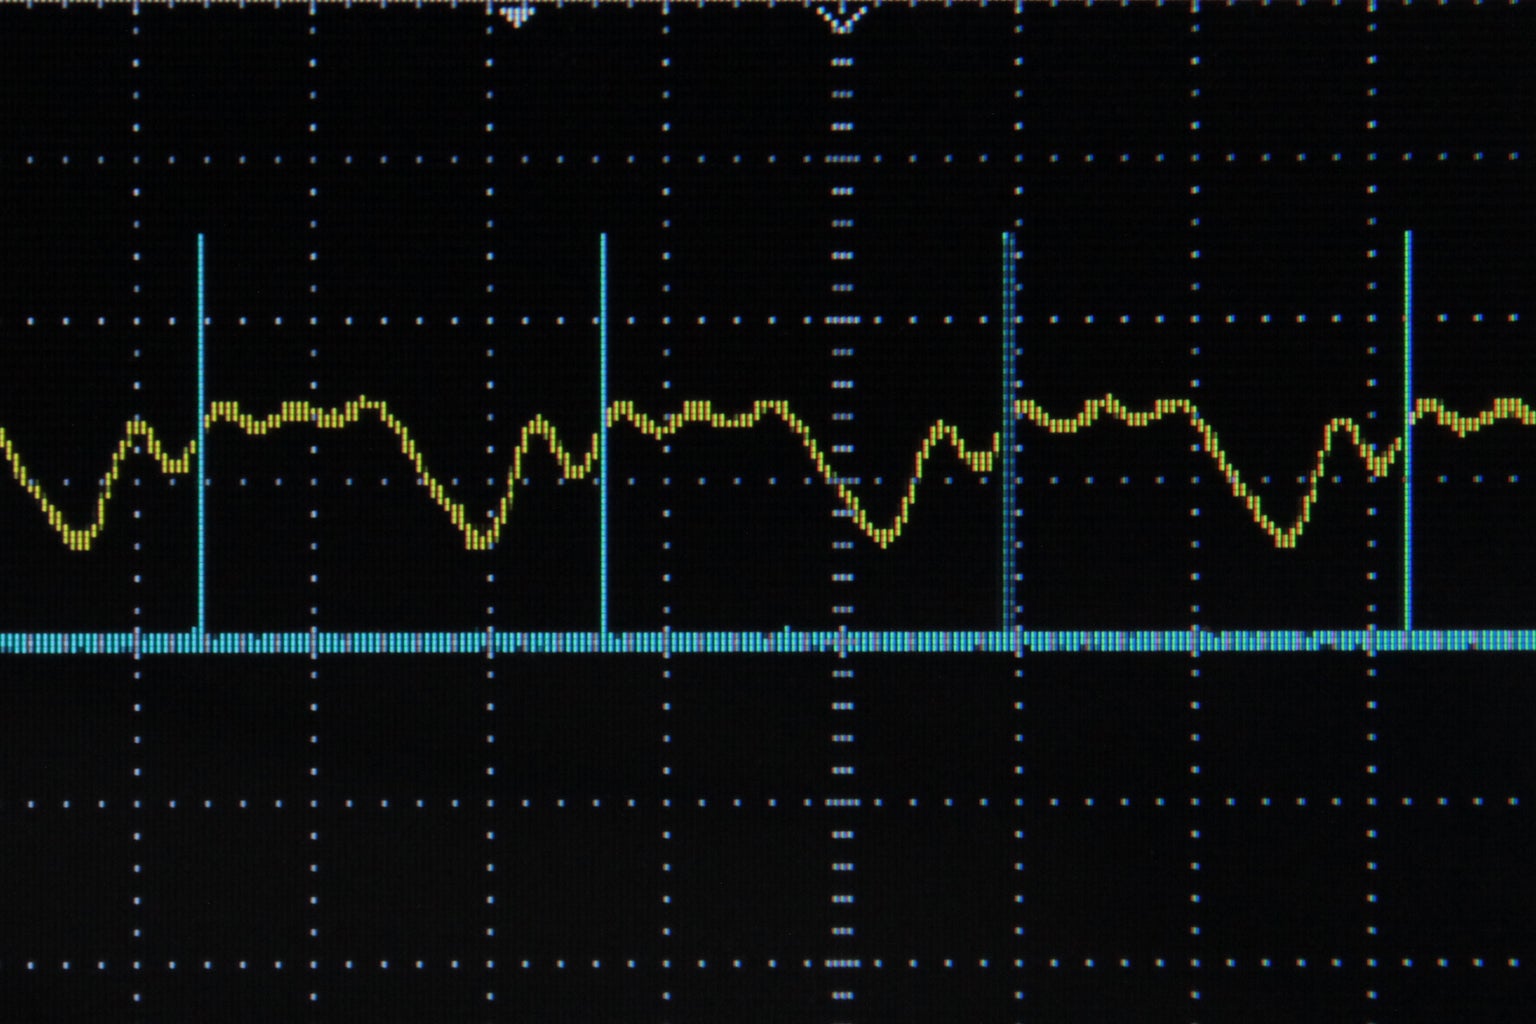
Fig 1 shows the pulse output in blue and the incoming signal to A0 in yellow. Notice how each time the signal crosses 2.5V, the pulse output toggles. Specifically, the output goes high when the signal crosses 2.5V with a positive slope and the signal goes low when the signal crosses 2.5V with a negative slope. Fig 2 shows the pulse output in blue and the audio signal before it has been +2.5V DC offset in yellow. Remember, this DC offset was necessary to get the audio signal in the 0-5V range for the Arduino's analog input pin, but normally audio signal oscillate around 0V. In fig 2 you can see how the pulse outputs toggle corresponds to the time when the audio signal crosses 0V. Fig 3 shows an arbitrary waveform in yellow (again before DC offset) and the pulse output in blue. Again, the pulse toggles each time the yellow signal crosses 0V, notice how the behavior of the pulse output with the arbitrary waveform is more complex than with the sine wave.
Step 3: Sine Wave Frequency Detection


prevData = newData;//store previous value
newData = ADCH;//get value from A0
if (prevData < 127 && newData >= 127){//if increasing and crossing midpoint
period = timer;//get period from current timer value
timer = 0;//reset timer
}
timer++;//increment timer
Then in the main loop() function, I calculated the frequency by dividing the timer rate by the period. I used Serial.print to print these results in the Arduino serial monitor.
frequency = 38462/period;//timer rate/period
//print results
Serial.print(frequency);
Serial.println(" hz");
Fig 1 shows the signal coming into A0. The start and end of one cycle measured by timer is indicated by the image note. Fig 2 shows the output from the serial monitor (command/ctrl+shift+m). This technique works great for sine waves, but when wave become more complicated (and cross 2.5V more than twice in one cycle) this technique breaks down.
Step 4: Generalized Pitch Detection


Basically what I did was choose a voltage that I always knew would be in the bounds of my wave (2.5V). Then I looked at every time the wave crossed this level with an upward slope, let's call these "threshold events". If this happened multiple times in one cycle I chose the threshold event with the largest slope to be the beginning of my cycle. Similar to the last step, I used a variable called "time" (incremented at a rate of 38.5kHz) to measure the time between threshold events and stored this is an array called timer[]. I also recorded the slope at each of the threshold events in an array called slope[]. Then I compared the elements of timer[] and slope[] to figure out where there was a match. Once a match was found, I added up the elements of timer[] to determine the duration of the cycle and sent this value to a global variable called "period." Then in the main loop() function (all of the steps I've just described happen in the ADC interrupt routine) I used the value of period to calculate the frequency and print it. I should also add that I put a variable in the code called "noMatch" which helped me to decide that it had been too long since I had a good match and that I should just rerecord the elements of timer[] and slope[].
When writing this I thought about a lot of possible scenarios that might break the algorithm. The trickiest wave in my mind is one which passes the 2.5V threshold many times in one cycle at similar slopes and spaced out along the cycle similarly. I you have a wave like this, you should keep slopeTol very low (0-3) and you might find that lowering timerTol (to 5 maybe) helps track the wave correctly. Also, if you want to measure waves with very steep slopes (like pulse waves) you should set the value of slopeTol up to 100 or even all the way up to 256 to track them better.
Generally this piece of code seems to handle lots of shapes very well, you can see some of my results in the images above. The incoming signal is shown in yellow and the threshold event that the Arduino is tracking is indicated by a pulse of pin 12 (blue).
I also added a bit of code to stop calculating and print frequency data when the amplitude of the wave falls below a certain level. (If there is little or no signal then the code above sometimes spits out a bunch of garbage). Here it is:

Participated in the
DIY Audio


