

Introduction: Arduino High Speed Oscilloscope With PC Interface


Use your Arduino and PC as a fast Storage Oscilloscope.
The Arduino can reliably gather voltage readings at a frequency of between 141 and 153 KiloHertz.
1000 data readings can be taken in around 6.8ms .
Transfered to a PC, these points can be accurately plotted against time.
This Instructable will show you how the analogue input can be repeatedly added to a 1000 byte buffer and then transferred to a serial monitor. The data is collected using a high frequency interrupt, whose period can be accurately determined. The frequency can be altered to produce a range of possible periods.
I have written a PC interface to display the data and control the arduino. My PC program is presented as is - it would take a very long instructable to explain it!
The data output from the Arduino is not complex. I am sure others will write interfaces for the operating system of their choosing ....
I have written two slightly different versions for the Arduino data capture. One utilizes software triggering for when an accurate change in voltage is required, before the oscilloscope triggers. The second, uses hardware edge triggering based on an interrupt on Arduino pin 2. The hardware version runs a little faster at the highest frequency.
.
I did a minor rewrite today (31/8/2014). The PC interface now includes the option to set the voltage reference to accurately reflect the real value of the Arduino "5V" line. There are also small adjustments to the Arduino software.
.
As of 6/9/2014 I have developed a slightly modified version of the Software Triggered version which runs at up to 227.3 KHz on my Mega, using register commands to directly control single conversion reads. If there is interest, let me know.
The ADC Arduino Mega information is to be found in pages 242-260 of the Amtel atmega328p manual.
.
As of 29/9/2015 the PC and Arduino software have been updated.
The video is best viewed in High definition (720p), full screen:
Attachments

Step 1: Requirements


Arduino Mega 2560 (Let me know if other arduino types work)
.
The following component works- alternatives may be viable (with program tweaking- I leave that to you!)
LCD Keypad Shield http://www.hobbytronics.co.uk/arduino-lcd-keypad-...
.
Simple Buffer box to accept analogue voltages: (Only required if you don't already have voltage buffers)
NE5534P op amp
22pf, 10nf capacitors
Two 100K variable resistors
22K, 4k7, 12K, two 470K resistors, 0.25W ok
10K precision resistor (1%)
Two 1K variable resistors
10uF electrolytic capacitor, 16V or more
Copper Stripboard, Plastic Box, Connectors and soldering equipment
A multimeter
Balanced +-9V supply (At least +-6V is needed to allow the NE5534P to produce 5V at the output)
.
A PC with a windows operating system. I have tested my interface on XP, Windows 7 and windows 8.
(Or make your own software interface.)

Step 2: The Specifications


The Arduino program:
Both versions sample on Analogue port 1.
.
The data can be captured with or without a trigger.
The sampling frequency is controllable, allowing different sample periods.
Some text information is sent to the serial port and lcd screen.
The lcd screen buttons control trigger slope, sample period and sampling.
The voltage data is output as bytes in a buffer. (This is for speed)
A program is needed to capture the raw data.
.
1) Oscilloscope.ino
Software trigger version.
The trigger level can be specified in mV. Sampling commences when the voltage climbs above (or falls below) by more than the trigger value, between two subsequent sampled readings.
The trig level is a best fit, limited by the resolution of the a/d port.
The reference voltage can be set. (Useful if you find the "5V" line is not at 5V, or you are using a device whose reference is entirely different.)
.
2) OscilloscopeExt.ino
Hardware trigger version.
The trigger is hardware controlled by digital port 2.
Simply connect your input to analogue port 1 and digital port 2.
It is activated by setting a non zero, positive, trigger level.
.
Common Specifications
Real time Oscilloscope using interrupts.
Serial, LCD and flash memory support.
Lcd button support. (The Lcd adc port is specified by the variable lcdport)
Serial Monitor set at 115200 baud.
SDCARD detected for future development.
If required, the following hardware has been tested:
- MicroSD Breakout Board Regulated with Logic Conversion V2 http://www.hobbytronics.co.uk/microsd-card-regula...
- 4GB Micro SD Memory Card http://www.hobbytronics.co.uk/microsd-card-regula...
.
Data is written to a 1000 byte buffer, which when full is written to the Serial port.
Serial output format:
Zero byte (handshake)
4 bytes with the integer value of sampling frequency in milli Hertz
1000 bytes of data
.
Sampling can be a single event or repetative (A fast run).
In a fast run the arduino will wait for a serial response of any character for 1500 milli seconds after outputting data. If a character is received (a handshake), the Arduino will immediately gather more data. If 1500 mS is up more data is recorded, regardless.
.
The buttons on the LCD Keypad Shield will produce the following result:
Select - initiates a new sample (or curtails a fast run)
Up - Positive edge trigger
Down - Negative edge trigger
Left - Decrease sampled period (increases Prescalar)
Right - Increase sampled period (decrease Prescalar)
Note that the LCD screen requires Analogue port 0 to allow the buttons to work.
After sampling basic information is displayed on the Lcd.
.
Serial Input commands:
'again' Initiate new data capture.
'test' Toggle a square wave on PM3 Square for testing.
'trig' Trigger level set. If 0 is sent triggering is cancelled. Non zero trigger levels produce triggering. The lcd screen buttons control whether the trigger is on a posive or negative slope.
'run' Repeated sampling- a fast run. No serial port text is sent during a run- only raw data.
During a fast run the sample period and edge select can be altered. A fast run is stopped using the lcd select key.
.
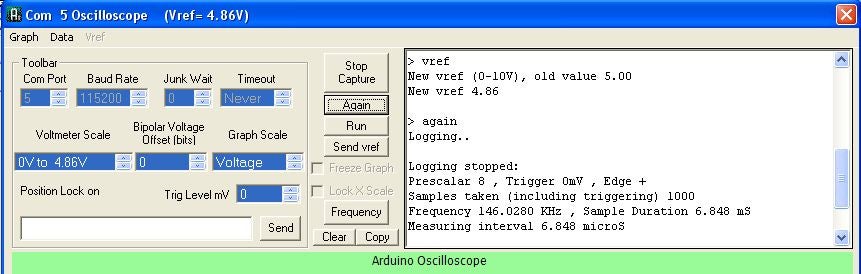
The PC Interface:
Capture raw com port oscilloscope data- from Arduino.
Send text to control Arduino.
Receive text from Arduino.
Set arduino trig level and sample frequency.
Initiate sampling and fast runs.
Set voltage reference "vref" to match Arduino. Send vref to Arduino. Note that only the software oscilloscope version uses this information. (To calculate the sofware trigger level).
Setting the voltage reference displays the voltage more accurately than working with the default 5V level.
.
Graph incoming data against time.
Available scales:
raw 0-255
0V to 5V
-2.5 to +2.5V
-5 to +5V
-9 to +9V
.
Graph time axis calculated from received sampling frequency.
Data can be sampled once or repeatedly.
.
During repeated sampling:
X axis scaling can be frozen to maintain comparison positions
The entire graph can be frozen.
.
Output readings to a data file (see scopedata.txt)
.
Calculate data frequency based on-
1) positive edges around the average of the data maximum and data minimum voltage
2) dsp method detailed at ' https://www.instructables.com/id/Reliable-Frequenc...
.
Clipboard copy of graph and data info-screen.
jpg image file of oscilloscope display.
Printer output of oscilloscope display.
Zoom option in graph.
.
Junk wait setting to trash spurious startup characters from Arduino.
Timeout setting to cease capture when comport stops receiving characters.
Set serial baud rate.
The application locks position when capturing-
this ensures that the interrupts that would occur can not slow down the sampling.
Last settings saved.
Attachments
Step 3: Setting Up the Interrupt for the Software Triggered Version


There have been several excellent instructables on setting up fast data capture on the arduino.
I have developed the following from a variety of sources.
I use the variable prescalar to control the frequency of the sampling interrupt.
Essentially we set up an interrupt which grabs data automatically at a controllable frequency.
Once the interrupt starts, data is captured in an interrupt routine.
If triggering is on, data is not transferred to the buffer until the triggering condition is met.
The analogue port is specified by the variable adport. ( ADMUX |=adport )
The frequency is defined using a prescalar. (ADCSRA register: bits ADPS2, ADPS1 and ADPS0. )
These bits determine the division factor between the system clock frequency and the input clock to the ADC.
.
The Arduino 5V is used as a voltage reference. (The REFS0 bit)
Note that the Voltage on my USB port appears to drive my Arduino at 4.76V.
If I connect a power supply to the Arduino the '5V' line is at 5.06V
If you are seeking accuracy, supply external power!.
.
Set the number of bits used in the analogue port capture. For speed 8 bits are read. The ADLAR bit controls the presentation of the ADC conversion Write one to ADLAR to left adjust. Otherwise, the value is right adjusted. This has an Immediate effect on the ADC Data Register.
.
Set the bits in ADCSRA for the frequency prescalar. (ADPS0, ADPS1, ADPS2 bits)
.
Set the interrupt to repeatedly Auto Trigger when the analogue port is read. (The ADATE and ADIE bit)
Enable the ADC. (The ADEN bit)
Note the use of the sbi function. This and the cbi function are very useful for setting and clearing data register bits.
Start the ADC interrupt. (The ADSC bit)
.
// Setup continuous reading of the adc port 'adport' using an interrupt
//
cli(); // disable interrupts so that we can change registers without being interrupted
//clear ADCSRA and ADCSRB registers
ADCSRA = 0;
ADCSRB = 0;
ADMUX |= adport; //set up continuous sampling of analog pin adport
ADMUX |= (1 << REFS0); // set reference voltage to AVCC
ADMUX |= (1 << ADLAR); // left align the ADC value- so we can read highest 8 bits from ADCH register only
// Set the prescalar. 8 is the fastest workable frequency
// 8 prescalar 143Khz (after tolerable interrupt speed reduction)
if (prescalar==8) ADCSRA |= (1 << ADPS1) | (1 << ADPS0);
// 16 prescalar - 72 Khz sampling
if (prescalar==16) ADCSRA |= (1 << ADPS2);
// 32 prescaler - 16mHz/32=500kHz - produces 37 Khz sampling
if (prescalar==32) ADCSRA |= (1 << ADPS2) | (1 << ADPS0);
// 64 prescalar produces 19.2 Khz sampling
if(prescalar==64) ADCSRA |= (1 << ADPS2) | (1 << ADPS1);
// 128 prescalar - 9.4 Khz sampling if (prescalar==128) ADCSRA |= (1 << ADPS2) | (1 << ADPS1) | (1 << ADPS0);
ADCSRA |= (1 << ADATE); // enable auto trigger
ADCSRA |= (1 << ADIE); // Activate ADC Conversion Complete Interrupt
sbi(ADCSRA,ADEN); // enable ADC
ADCSRA |= (1 << ADSC); // start ADC measurements on interrupt
starttime=micros(); // record time so that we can calculate period and frequency
// enable interrupts and off we go!
sei();
.
The Interrupt code
The adc interrupt is serviced by the ISR(ADC_vect) routine.
Variable bufcount is the position in the buffer, whose size is BUF_SIZE (=1000).
Flag triggered is true when data can be captured.
When the buffer is full flag writeit is set true and the adc is disabled. ( cbi(ADCSRA,ADEN); )
To trigger the interrupt either triggered is set to true in setup and the data starts recoding immediately.
Or the newval data item is compared with the previous oldval.
If the difference is greater than the trigger, triggered is set to true and the data is stored in the buffer.
The variable trigcount is used to count the number of data items read during triggering.
This number is added to the buffer size during the frequency calculation to maintain the accuracy of the observed frequency.
.
// this is the key to the program!!
ISR(ADC_vect) {
if (triggered){
bufa[bufcount]=ADCH;
bufcount++; // increment buffer counter
if (bufcount==BUF_SIZE) {
cbi(ADCSRA,ADEN); // disable ADC
endtime=micros(); // record endtime for interval calculation
writeit=true; // flag that a write is needed
}
} else {
// look for a trigger
newval=ADCH;
trigcount++;
trip = newval-oldval;
if(!trigplus) trip = -trip;
if (trip > trigger) triggered=true; else oldval=newval;
}
}
Step 4: Setting Up the Interrupt for the Hardware Triggered Version


This method is very similar to the software version.
Triggering is handled differently.
Digital Port two must be connected to analogue input 1, for this to work.
Essentially if no triggering is selected, the adc interrupt is enabled and data is captured immediately. If triggering is selected an interrupt on digital port 2 is used to enable the interrupt on the adc port 1.
Digital port 2 can be configured to read analogue signals and generate an interrupt on rising or falling data edges. It is very fast.
My interrupt routine is called gotinterrupt and as I am using digital port 2 the interrupt id is 0.
const byte ExtInterrupt = 2;
pinMode(ExtInterrupt,INPUT);
attachInterrupt (0, gotinterrupt, RISING);
attachInterrupt (0, gotinterrupt, FALLING);
.
The flag triggered controls whether the digital port 2 interrupt starts the analogue port 1 interrupt . When triggered is false the interrupt starts the adc interrupt when it detects an edge in the analogue input.
.
// same as the software interrupt code up to here..
sbi(ADCSRA,ADEN); // enable ADC
// then ..
if (trigger==0) {
sbi(ADCSRA,ADSC); // start ADC measurements on interrupt
starttime=micros();
}else{
// allow pw2 interrupt to start adc interrupt
triggered=false;
}
sei(); // enable interrupts
.
The Interrupt code
1) The port 2 interrupt is serviced by gotinterrupt
This interrupt is activated by a positive or negative edge on port 2.
It does nothing until triggered is false.
void gotinterrupt() {
if (!triggered){
triggered=true;
sbi(ADCSRA,ADSC); // start ADC measurements on interrupt
starttime=micros(); // record starttime for interval calculation
}
}
2) The adc Interrupt is serviced by ISR(ADC_vect)
Variable bufcount stores the position in the buffer, whose size is BUF_SIZE (=1000)
Data is stored in locations bufa(0) to bufa(999)
When the buffer is full flag writeit is set true and the adc is disabled. ( cbi(ADCSRA,ADEN); )
.
// ADC Interrupt routine
// this is the key to the program!!
ISR(ADC_vect) {
bufa[bufcount]=ADCH;
bufcount++; // increment buffer counter
if (bufcount==BUF_SIZE) {
cbi(ADCSRA,ADEN); // disable ADC
endtime=micros(); // record endtime for interval calculation
writeit=true; // flag that a write is needed
}
}
Step 5: Out-Putting the Data


The Void loop routine performs the following functions
1) If writeit is true:
- calculates the observed time period, correcting for micro time rollover
- outputs the buffer bufa
- calculates frequency in KiloHertz
- outputs buffer bufinfo, with a handshke zero byte and the frequency in milliHertz
- enables the lcd port so that the buttons can be read
- Switches off the test pulse on pw3
- Outputs text details to the serial port if showdetails is true (set false by a fast run)
- sets flag writeit to false and hasdata to true
The data is sent in two concurrent sections
- a) A 5 byte header buffer with zero, followed by 4 bytes which is the frequency in milliHz. Sending in milliHertz increases the accuracy of the conveyed frequency value.
- b) 1000 bytes of raw data, each in the range 0 to 255.
2) If hasdata is true
- check the lcd buttons
- if a fast run is active, look for a handshake character from the pc (or 1.5s timeout) and get more data
- check for serial input commands
.
LCD Buttons
The input is received by the subroutine buttoncheck.
The lcd buttons are read from analogue port 0.
Each button produces a voltage within a certain range of values
The left button, for instance lies in the range 400 to 599
- Select - initiates a new sample (or curtails a fast run)
- Up - Positive edge trigger
- Down - Negative edge trigger
- Left - Decrease sampled period (increases Prescalar)
- Right - Increase sampled period (decrease Prescalar)
.
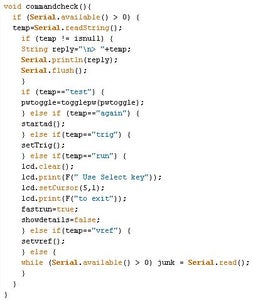
Serial Input Data
The input is received by the subroutine commandcheck.
'test' toggles a square wave on testpin (= digital port 3), using the flag pwtoggle.
pinMode(testpin,OUTPUT);
if (pwtoggle==false) analogWrite(testpin, 0);
if (pwtoggle) analogWrite(testpin,127);
This is very useful. Simply connect digital port 3 to analogue 1, directly.
'trig' sets the trigger level. In the software triggered version the trigger variable is used mathematically to set the triggering level. In the hardware version it simply toggles triggering.
'again' produces a one off sample
'run' produces a fast repeated sample
'vref' sets the voltage reference value. (Only used by the software triggered oscilloscope to interpret trigger level.)
Step 6: Setting Up the Windows PC Interface
Open winpcInterface.zip and extract to a folder of your choice.
You will find:
- oscilloscope.exe the windows interface
- MSCOMM32.OCX comport controller
- RICHTX32.OCX text box controller
- rm chart setup.exe graph drawing support
- ocxWIN7_8.bat batch file to install ocx on windows 7 or 8
- ocxXP.bat batch file to install ocx on windows xp
Install in this order
1) The graph support 'rm chart setup.exe' . I found this very useful package on the Internet. VB programmers will find this interesting!
2) For windows 7/8 copy the address of the folder in which you extracted the application. If you right click on the address in the bar at the top of windows file explorer you will find the option to copy the folder address.
3) The batch file for your windows operating system.
XP - 'ocxXP.bat'
win7 or win8 - 'ocxWIN7_8.bat'
For win 7/8 you will need to
- Right click on the batch file and run as administrator
- Paste in the address copied in stage 2 and then enter.
.
The ocx will be copied to the system directory and registered.
.
Ready to test!
Connect up your arduino.
Install one of the two arduino oscilloscope programs. (Hard or soft triggering version)
Exit any serial interface used to do this.
oscilloscope.exe can then be run.
Set the comport to the one used by your arduino.
Set the baudrate to 115200.
Click capture.
Connect digital port 3 to analogue 1.
Type test into the command box and return.
A square wave is available on the digital port. Select again and you will see it plotted by the oscilloscope.
Select frequency and you will get the square wave frequency. The first estimate is based on the rising edges at the midpoint of the voltage range. The second is based on a technique outlined in an excellent article at:
https://www.instructables.com/id/Reliable-Frequency...
The graph can be 'zoomed' using a mouse left click and drag, or un- zoomed with a right click.
Options are available to:
- fast 'run'
- freeze a fast run
- freeze the x-scale during fast run for data comparison.
- print or copy the graph
- output the data as a text file
- alter triggering levels
- alter y scale
- apply an offset for bi-polar y axis
- alter voltage reference
Step 7: Building a Simple Buffer Box for Analogue Input


There are many possible ways to pre-condition the voltage
Here are three simple Input conditioners for your oscilloscope:
- Voltage follower
- Bipolar +-9V to 0-5V converter
- A.C. coupler
The follower needs to be
- Fast
- High bandwidth
- Low noise
- High Input impedance
- Low Output impedance
The NE5534P fits the bill and is cheap. Datasheet: http://pdf.datasheetcatalog.com/datasheet2/d/0ji5w...
It has a simple dc offset circuit- make sure you trim the 100K pot to set the output voltage to zero for an input of zero.
I used a balanced +-9V supply. However +-6V would give enough headroom to provide an output of 5V. The absolute maximum is +- 22V.
.
The bipolar converter allows for a signal which is below zero to be measured by the analogue port, which can not be taken below zero.
This bipolar converter is interesting. In the past I have designed these with an op amp, precision voltage reference and lots of trim pots. This design was inspired by an article which was supported by Ronald Michallick of Linear Applications. He suggested using a three resistor bridge and supplied an excel spreadsheet to design it.
If you need a different range of input voltages use the spreadsheet to get your own resistor values.
Setup the two 1k trim pots with an accurate resistance meter so that the upper and lower resistors meet the design specification.
Some points to note:
a) The arduino "5V" level may not be accurate. Alter the spreadsheet b2-b3 values if you want strict accuracy.
b) Reducing +-9V to 0-5V is a voltage drop of 18 to 5.
one digit of our oscilloscope is 5*1000*1/255 = 19.6mV.
An input change of 18*19.6/5 will cause a change in the analogue port.
That is 70.6mV. So relatively coarse voltage changes are observed (with 71mV jumps).
.
The A.C. coupler is very straightforward. The DC bias is set at the midpoint of our analogue port voltage (5V).
No external DC will transfer across the 10uF capacitor. This circuit works well with a microphone pre-amp.
To setup this circuit connect to the arduino, Use the raw data scale on the pc software. Grab the port data and trim the 100K pot so that the input is 127. Or use a voltmeter and set to "5V"/2.
.
The circuits are all straight forward to build on one piece of Copper stripboard.
I suggest a socket for the op amp.
Putting the circuits in a box is useful, The separate outputs can be inter-connected as needs arise.
Note the 0.1inch connectors on the side of my box so that standard Arduino header leads can be used.
Check your circuits before testing. All responsibility for the use of this article rests with you.
.
Let me know when you get it working.
Attachments
Step 8: Project Developments
My turbo version is the fastest internal ADC. It uses a potentiometer to set the trigger level.
My 20Mhz version was developed from work done by Bob Davis , who realised that the Arduino was never going to be able to directly measure significantly high data rates. His elegant solution was to use an external ADC and a fifo to capture the data at a high clock frequency. Once captured, the fifo flags the data capture completion and the Arduino transfers the data at it's clock frequency.
The 20 MHZ oscilloscope uses the tlc5510a and a 2K fifo (IDT7203L12TPG). By using a 2K fifo I am able to trigger by downloading all the data to the mega and then processing the trigger point in memory. Once found, I upload the subsequent 1000 values to the PC. Triggering is therefore rock solid. I have edge and level triggering on either voltage slope. A simple potentiometer is used to set the trig point.
By applying 20 MHz clock through a SN74LS393N Dual 4-stage Binary counter I can range down to 0.078 MHz. I am using the adc chip in the 4V reference mode.
I have three input options.
1) "Direct" with a 4V3 zenner as protection. Useful if external buffering is to be used.
2) AC, with a simple 2u2 tantalium and 1K pot to set the mid voltage and a 4V3 zenner.
3) Buffered, with the input dropped across 4 matched 22K resistors. This produces equal attenuations. The drop is passed through the excellent NE5534P 10MHz low noise op amp, configured as a follower... and then to a 4V3 zenner. This produces input ranges of 0 to 4, 5.33, 8 and 16V.
Please refer to the data sheets should you wish to create a similar project!
At higher frequencies the board design must consider grounding and stage separation.
With a well structured PCB design and suitable (expensive) op amps for signal conditioning, higher frequencies are possible....

Participated in the
Tech Contest


