

Introduction: Arduino IoT Weather Clock


In this Instructable we will build a clock that also displays inside and outside climate conditions.
I used to have a cool little clock that, in addition to telling the time, also displayed the temperature inside the house, the date, and the outside temperature via a remote sensor. There were three main problems with the clock though. First, the remote temperature sensor that was placed outside never worked. It constantly lost connection with the main part of the clock and it devoured batteries. Second, the inside temperature was only listed for the room housing the clock. I was always wanting to monitor the temperature, for example, in the bedrooms as well. Last, the clock was just very ugly with a basic monochrome display and no backlight.
Today we will create a web-connected, Arduino-powered clock/weather station. Our clock will be much more powerful than any available from retail:
- We will have an attractive clock that is easy to read and fully customizable.
- We will get accurate temperature and humidity readings for inside the house.
- We can use multiple sensors placed around the house to get readings from as many rooms as we want.
- Aside from temperature and humidity, we will also get ambient light level readings and sound level readings.
- We will get very accurate outside temperature and humidity via the Yahoo Weather service.
- All our data will be on an online dashboard that is beautiful, fully customizable, and accessible from anywhere.
- Since the dashboard is available online, we can access it from a mobile device to monitor conditions in your home while you are away.
- We will get graphs of the data over time to observe trends that we can use to more efficiently use the home's air conditioning system.
Clock Display
The IoT weather clock in this Instructable displays the time, outside temperature/humidity, inside temperature/humidity, inside ambient light level, and inside sound level.
| Info | Display Image |
|---|---|
| Time |  |
| Outside Conditions |  |
| Inside Conditions |  |
| Inside Light Level |  |
| Inside Sound Level |  |
Step 1: Gather Your Parts


Step 2: Solder on Headers


Neither the CC3000 WiFi shield nor any of the sensors come with headers attached. In order to wire all of our components together, we will solder male headers to all of the connections on the shield and sensors.
Solder Headers to the CC3000 Shield
As with all Arduino shields, we will need to attach headers that will allow the shield to be connected to the Arduino. We will use a special type of header made specifically for Arduino shields, called stackable headers. Stackable headers allow the shield to plug into the Arduino while still allowing our sensors to be plugged into the Arduino through the shield.
Solder Headers to the Sensors
For the sensors we will use regular male headers. Solder the headers onto the underside of the sensor boards, so that wires plug in from the bottom.
Step 3: Prepare the Project Enclosure


Trim the Mounting Pegs
We will be mouting the Arduino and environmental sensors in a project enclosure just to keep everything together and avoid dangling wires. We will only be using the bottom half of the enclosure since the sensors need to be open to the air in order to work properly.
There is one small modification that needs to be made to the enclosure to properly mount the Arduino. There are four pegs inside the enclosure that we will use to mount the Arduino instead of using bolts. However, these pegs are too tall to place the CC3000 shield on top of the Arduino, so we will cut them shorter.
Using a wire cutter, trim down the pegs to about 1/2 inch tall. Be careful of your eyes when you do this because the ends of the pegs could shoot off at high speed.
Mount the Arduino
With the mounting pegs trimmed down, place the Arduino board into the project enclosure with the USB port and barrel jack facing the bottom of the enclosure.
Don't attach the CC3000 shield to the Arduino quite yet. Just to give you a preview of the steps to come, we will be mounting the sensors in the empty space above the Arduino. Then we will mount the CC3000 shield with the wires running underneath the shield to keep everything tidy.
Step 4: Attach Standoffs to Sensors


Now that we have the Arduino mounted in the project enclosure, let's turn our attention to the sensors. We will be using plastic standoffs to mount the sensors in the project enclosure. So, the first step is to attach the standoffs to the sensor boards.
For the temperature/humidity sensor the process will be easy because this sensor has mounting holes. Simply insert a plastic screw through each of the mounting holes and screw a standoff to the bottom.
Attaching standoffs to the ambient light sensor and the microphone will be slightly trickier due to these sensors' lack of mounting holes. We will use super glue to attach the standoffs to the bottom of these sensors. Since these sensors are so little, just one standoff for each will offer plenty of strength to hold the sensors in place.
So, first of all put on some latex gloves because getting your fingers super glued together is the worst.
Step 5: Drill Holes for Mounting Sensors

With the standoffs attached to the three sensors, we now need to drill holes in the project enclosure where we will connect the male ends of the standoffs. It is not important to exactly position each hole, we just want to spread out the sensors a bit across the empty space in the project enclosure above the Arduino board.
I like to drill one hole in the center of the circular ring in the enclosure, this will be where we mount the ambient light sensor.
On one side of the middle hole, drill two more holes spaced 10mm apart. This is where we will mount the temperature/humidity sensor.
Last, drill another hole on the other side of the center hole for the microphone.
Step 6: Attach Wires to the Sensors

We will want to attach wires to the sensors before mounting the sensors in the enclosure because it will be a bit cramped to get the wires attached after the sensors are mounted.
First, each sensor has a ground connection and a power connection. Attach a black male-female jumper cable to the ground connection on each sensor. Then attach a red male-female jumper wire to the power connections on each sensor.
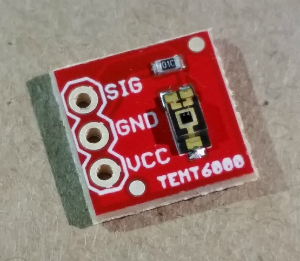
On the temperature/humidity sensor there are two additional pins besides the GND and 3.3V pin: the SDA pin and the SCL pin. Attach a jumper wire to each of these pins. Make sure to use colors other than black and red so you do not get confused later on.
Both the ambient light sensor and the microphone have one additional pin each. Attach jumper wires to these two pins, SIG on the ambient light sensor and AUD on the microphone. Use unique colors for each connection so you can more easily tell which wires attach to which sensors.
Step 7: Mount Sensors in Project Enclosure


Now, with standoffs and jumper wires attached to the sensors, we are ready to mount the sensors in the project enclosure using the holes we drilled earlier. Mount the ambient light sensor in the middle hole, the temperature/humidity sensor in the pair of holes, and the microphone in the remaining hole. Place a nut on the back of the standoffs to secure the sensors.
The wires for the sensors should pass over the top of the Arduino and out the bottom side of the project enclosure, next to the Arduino's USB port and barrel jack connectors.
Step 8: Connect 3.3V Wires
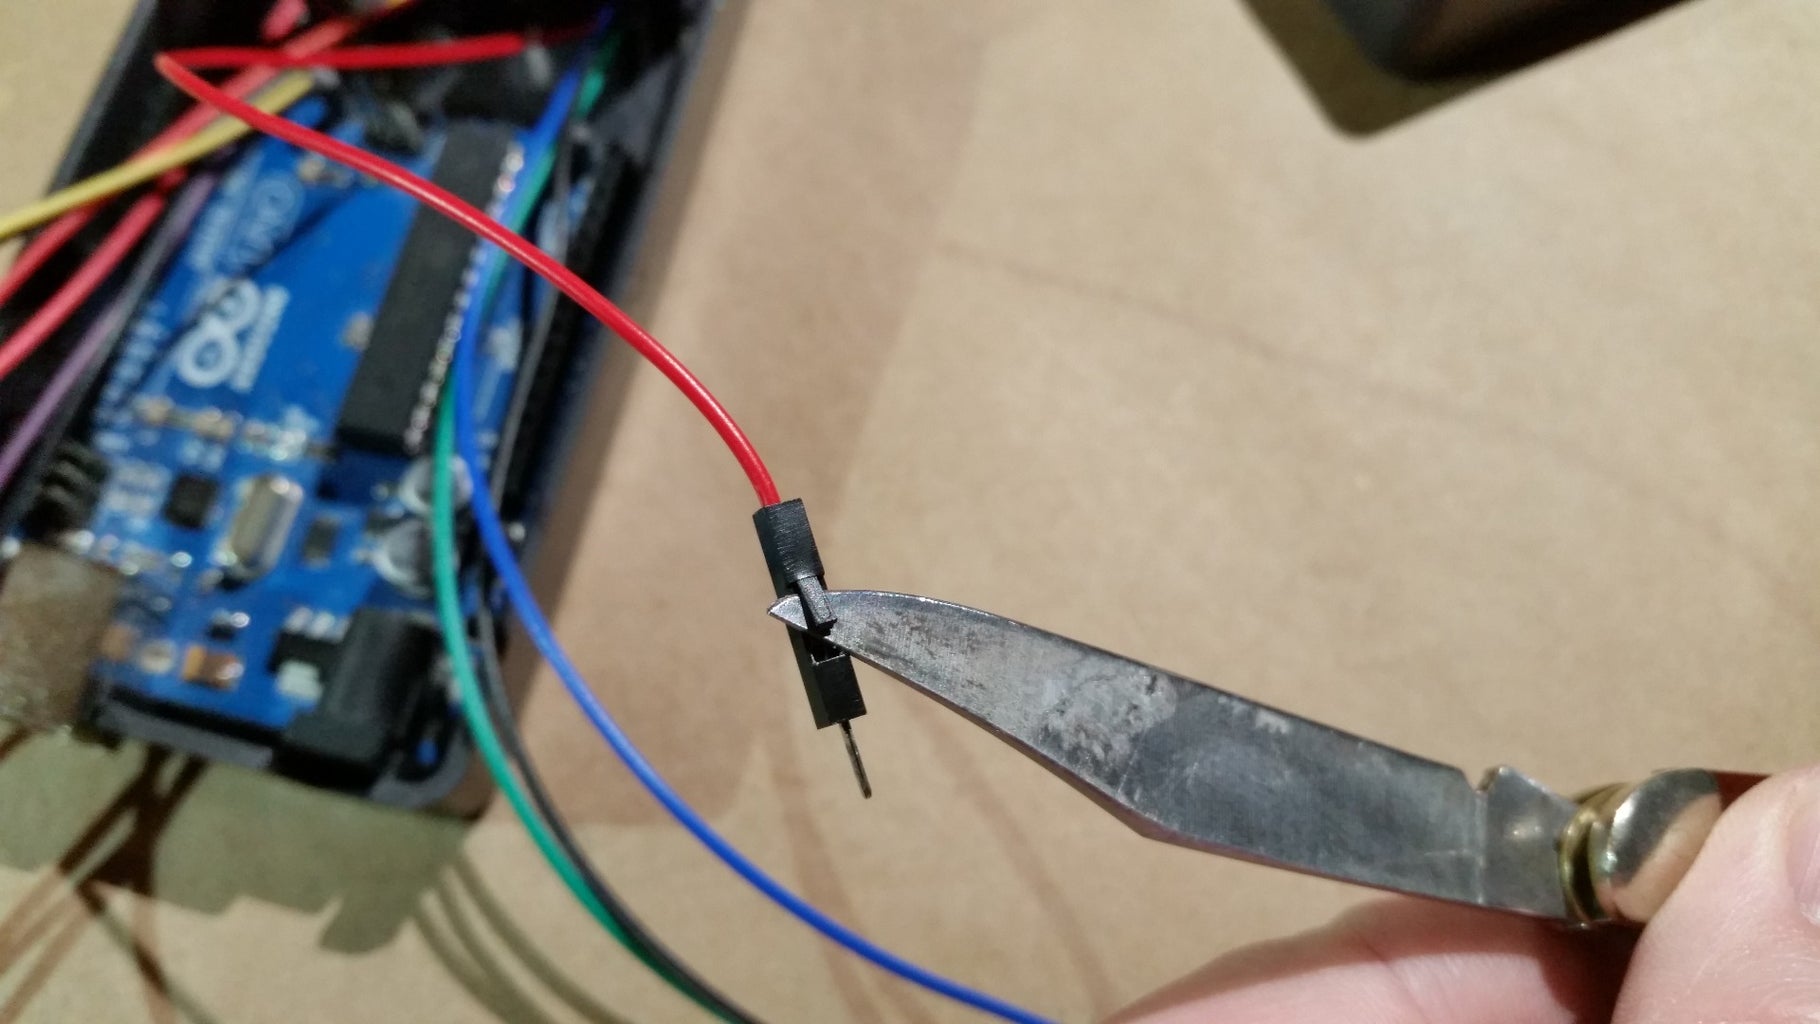


We have one minor problem in our setup that we need to overcome. Both the temperature/humidity sensor and the ambient light sensor need to be powered from 3.3V, not 5V. However, there is only one 3.3V output on the Arduino. Therefore, we will need to connect the male ends of the jumper wires for these two sensors so they can both plug into the Arduino's 3.3V output.
First, pick one of the jumper wires, it does not matter which, and remove the plastic housing from the male end by prying up the latch on one side and sliding the housing off. See the pictures on this step for clarification. Make sure to save this black plastic housing piece because we will be putting it back on the wire in a few minutes.
Next, take the other red jumper wire, cut off the male pin end close to the connector, and strip about one inch of the insulation off the wire.
Now wrap the exposed wire from one of the jumpers tightly around the male pin of the other wire. Ordinarily we would solder this connection, but since we are going to be putting back on the plastic housing piece, we want to make sure not to create any obstructions causing it not to fit.
Finally, press the black plastic housing piece back onto the male jumper pin. Now you have a single jumper pin with two wires attached to it.
We are going to use this same procedure with two of the ground wires in the next step.
Step 9: Connect Two GND Wires


In the previous step we connected together the 3.3V wires from the temperature/humidity and ambient light sensors because we only have one 3.3V output on the Arduino. Well, we have a similar problem with the ground connections. We have three ground connections, one for each sensor, but only two ground pins on the Arduino. Therefore, we will use exactly the same procedure used in the previous step to connect together two of the ground wires.
Take one wire and remove the plastic housing. Then take a second wire, cut off the plastic housing and strip one inch of insulation off the end. Wrap the exposed wire around the exposed male pin. Finally, put the plastic housing back onto the pin.
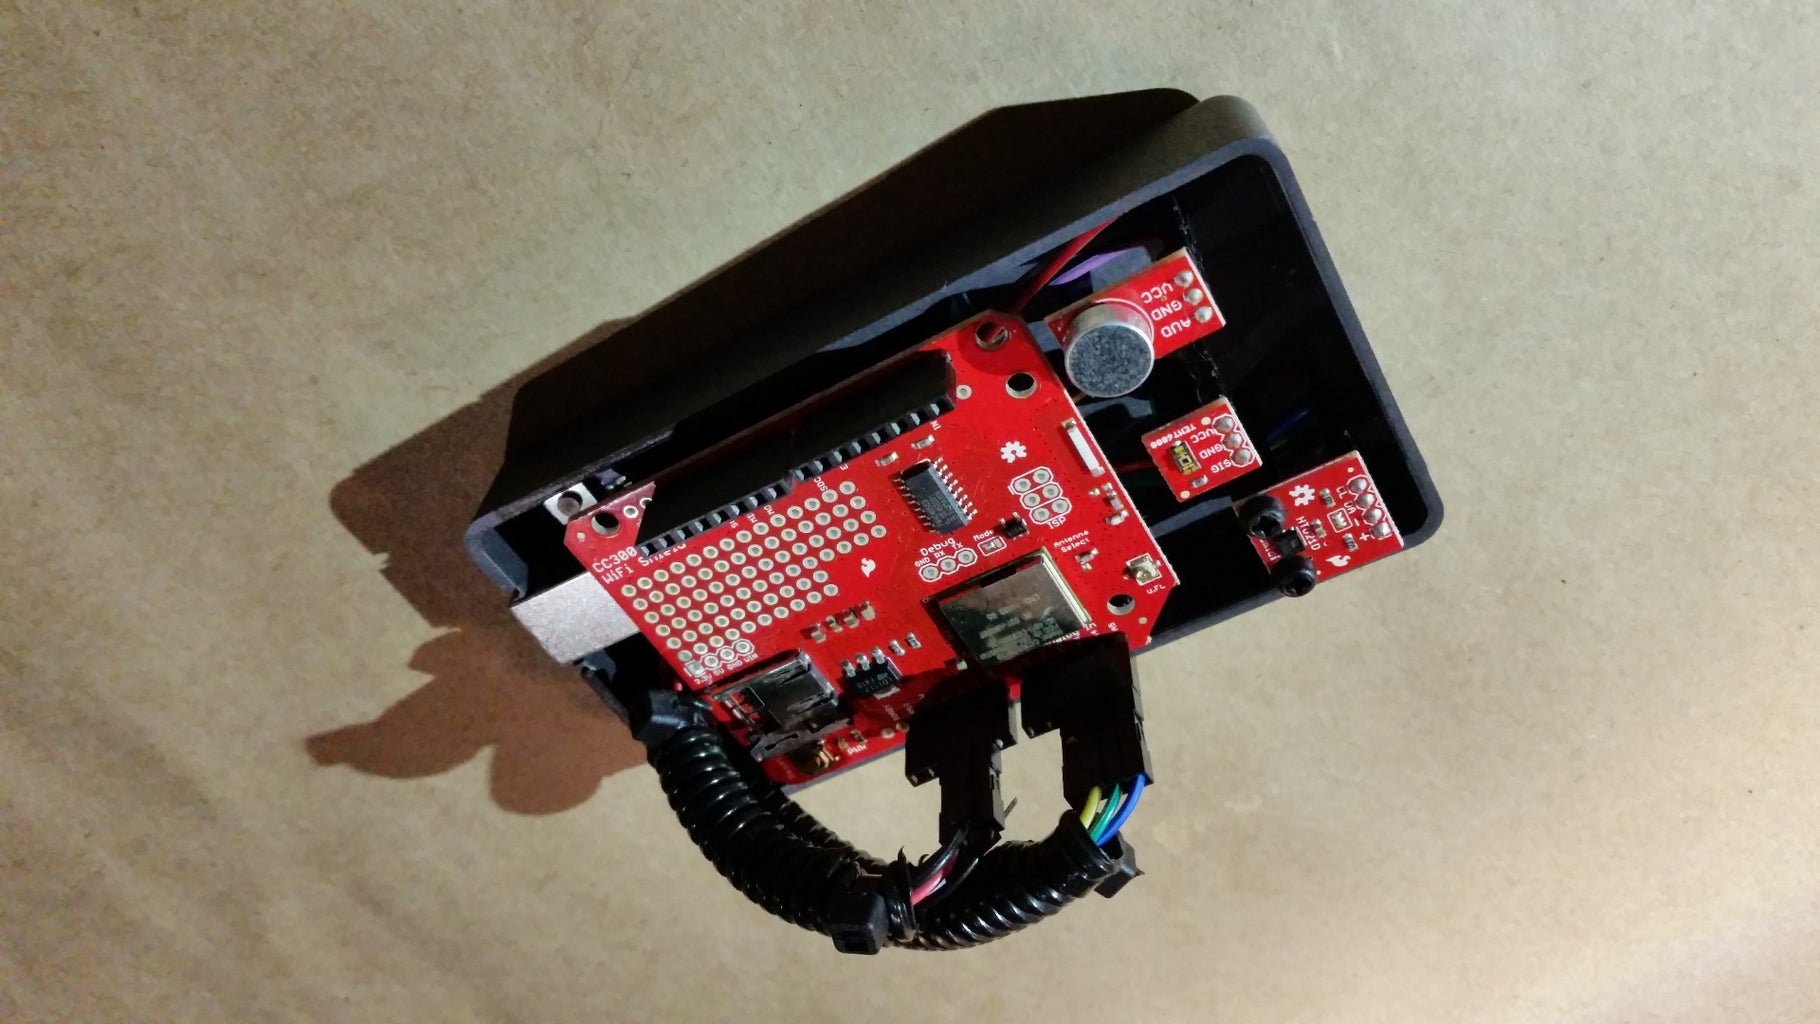
Step 10: Mount the CC3000 Shield


We mounted the Arduino into the project enclosure some time ago, but we did not attach the CC3000 WiFi shield to the Arduino at that point. We are going to do some cable management by attaching the CC3000 shield to the Arduino with the wires from the sensors running between the Arduino and the shield. This will give us a much cleaner setup than if we had wires piled like a bowl of spaghetti on top of the board.
So, first arrange the sensor wires so that they sit against the actual Arduino PCB. Make sure none of the wires are on top of any headers on the Arduino. Then, simply plug the CC3000 shield on top of the Arduino board just like we do with any Arduino shield.
Step 11: Connect the Sensors to the Arduino


We've been working hard on getting the sensors installed and ready to go and the time has finally come to connect the sensors to the Arduino board. The images below show how each individual sensor should be connected to the Arduino. The most important part of wiring the sensors is to make sure that the temperature/humidity sensor and the ambient light sensor are connected to the Arduino's 3.3V output via the wires we connected together.
Connecting the Ambient Light Sensor

For the ambient light sensor, GND connects to ground, VCC (which is joined to the wire from the temperature/humidity sensor) connects to 3.3V, and SIG connects to A3.
Connecting the Microphone
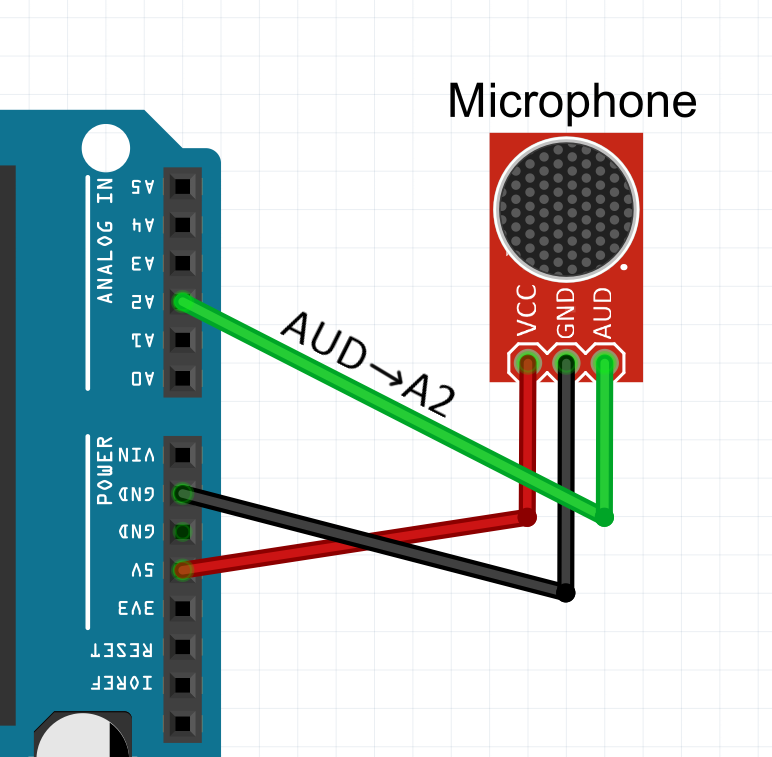
For the microphone, GND connects to ground, VCC connects to 5V, and AUD connects to A2.
Connecting the Temperature/Humidity Sensor

For the temperature/humidity sensor, + (which is joined to the wire from the ambient light sensor) connects to 3.3V, - connects to ground, SDA connects to A4, and SLC connects to A5.
Step 12: Optional: Add Some Wire Wraps


Because of the way we ran the sensor wires under the CC3000 shield, our IoT sensor should already be quite tidy in terms of cable management. However, if you'd like, you can make the sensor look even better by wrapping the wires. I like to use short lengths split loom tubing to enclose all the wires and give the sensor a finished look.
Step 13: Upload Code to Arduino
Congratulations, you are now finished with the hardware side of the project. However, we still have some work to do on the software side. First we will upload the Arduino sketch to make the IoT sensor work, then, in a few moments, we will set up our IoT weather clock dashboard on Freeboard.io.
For now, head over to GitHub to download the sketch for this project:
https://github.com/Toglefritz/Arduino-IoT-Weather-Clock
Configuring the Code
In order to get the code to work properly, you will need to change a couple of values: your WiFi SSID, your WiFi password, and your Thing name.
The first two inputs are easy. In the sketch, input your home WiFi SSID and password on lines 85 and 86 respectively.
85    char ssid[] = "yourSSID";  // The name of your home WiFi
86    char password[] = "yourPassword";  // Your WiFi passphrase
The third part, setting your own Thing name, will take a bit of explanation. We will be using two related online services to go from sensor data on the Arduino to a beautiful clock/weather Dashboard: Dweet.io and Freebord.io. We will cover setting up Freeboard.io in the next step. For now we will concentrate on Dweet.io.
Dweet.io is a super simple way to let IoT projects stream data to the web so that the data can be used by other services or devices. A Dweet.io stream is a simple list of readings, each identified by a Thing name, a date stamp, and a set of key/value pairs. The key/value pairs are the parts that contain the actual sensor readings. An example Dweet might look like:
{"thing":"my-thing-name","created":"2014-02-17T01:10:21.901Z","content":{"temperature":"21"}}
Dweet.io does not use username/password credentials, rather, it uses objects called "things" to store information. IoT projects can simply push data to Dweet.io and all they require is a unique Thing name that identifies the device. So, on line 109, specify your Thing name:
109 char thingName[] = "yourThingName_randomString";
By default, your Dweet stream will be publicly accessible. We are not displaying any sensitive data but you might still want to give your Thing a complicated name so nobody else can find it. For example, you could use a Thing name like "YourThingName_6Trz9OBjoVmM". If you want your data to be private, it only costs $0.99 per month for a "lock."
Once you've uploaded the code, your Arduino IoT sensor will being taking readings of the conditions inside your home, and sending that data to Dweet.io.
Step 14: Set Up Freeboard.io
We are rapidly approaching the conclusion of this project! The last task we need to complete is setting up Freeboard.io, the service we will use to create the IoT clock/weather display itself.
First head over to the Freeboard.io site and either create an account as you've probably done with dozens of other websites, or sign in using Twitter, GitHub, or Facebook. Once logged in, create a new Freeboard using the button in the upper-right corner of the screen; you can name it whatever you like.
Adding Data Sources
You should now be looking at a blank Freeboard. We will begin the process of setting up the display by adding data sources. Data sources are locations from which our various Freeboard panes will pull information. We will need a total of three data sources:
Begin by clicking the ADD button in the upper-right corner of the screen. In the TYPE dropdown, choose Clock. Once you select this option, two additional options will appear. In the NAME field, give this data source a name that will allow you to differentiate it from the other data sources we will be adding, I named mine Datetime. Then, in the REFRESH EVERY field, input 1 second, which should be the default value. Finally, click SAVE.

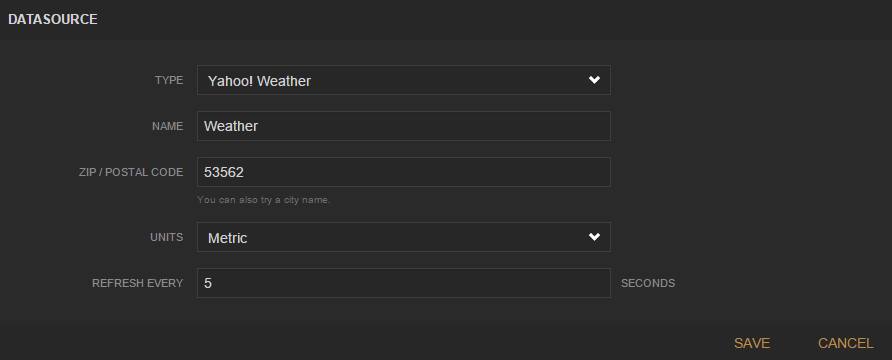
That's one data source down and two to go. Click the ADD button again. This time, in the TYPE dropdown, select Yahoo! Weather. As before, a number of other fields will appear once you select this option. In the NAME field, enter Weather. In the ZIP/POSTAL CODE field, input your zip code. In the UNITS field, choose either Imperial or Metric, depending upon your preference. In the last field, REFRESH EVERY, input 5 seconds. Then click SAVE.
Now for the last, and probably most important, data source. We will add a Dweet.io data source which will allow Freeboard.io to pull information pushed to Dweet.io from our Arduino IoT sensor. Again click the ADD button in the upper-right corner. In the TYPE dropdown, select Dweet.io. In the NAME field, input Dweet.io. Then, in the THING NAME field, input the Thing name you used in your Arduino sketch as described in the previous step. The last field, KEY, will be left blank unless you've paid for a private key on Dweet.io. Last, click SAVE.

Adding Panes
Now that we've set up data sources, Freeboard.io will be able to access all the information we need to set up the display. The display itself uses Panes, which are like individual windows inside the Freeboard page that each display a piece of data from one of the data sources.
To add our first pane, click ADD PANE in the upper-left corner of the screen. You will see a little blank box appear on the Freeboard display. This first Pane is going to display our indoor sound levels from the microphone on the Arduino IoT sensor. Click the Wrench icon on the newly added Pane. In the TITLE field, input Indoor Sound Level, and in the COLUMNS field, input 3, which will make this Pane span across the entire display. Then click SAVE to close the Pane settings box.

Now we need to add the actual sensor display to the Pane, which is called a Widget. Do this by clicking on the + (plus) icon in the upper-right corner of the Pane, next to the Wrench icon. In the TYPE dropdown, select Sparkline. In the TITLE field, input Inside Sound Level. In the VALUE field we will select our Dweet.io data source, input datasources["Dweet.io"]["soundlevel"]. In the INCLUDE LEGEND slide the toggle to YES. Finally, in the SPARKLINE LABELS field, input Sound Level. Finally, click SAVE.

That's one Pane finished. We will need to add a total of four more Panes: weather, time, inside conditions, and inside light level. To add our next Pane, click the ADD PANE button again. As before a blank Pane will appear at the top of the page. Click and drag the Pane below the Inside Sound Level Pane we just added. Click the Wrench icon and in the TITLE field input Weather. Leave the COLUMNS field as 1.
Click the + (plus) icon. In the TYPE dropdown, select Text. In the TITLE field, input Outside Temperature. In the SIZE dropdown, select Big. In the VALUE field, input datasources["Weather"]["current_temp"]. Set both the INCLUDE SPARKLINE and the ANIMATE VALUE CHANGES to YES. Last, set the units to correspond with the value, Imperial or Metric, you set for the Yahoo! Weather data source and click SAVE.

Click the + (plus) icon on the Weather pane again and input all the same values you just did except give this Widget a title of Outside Humidity, and in the VALUE field, enter datasources["Weather"]["humidity"].

Next we will create the clock display Pane in the center of the Freeboard. Once again click the ADD PANE button to create a new Pane. Drag the new Pane to the right of the Weather Pane so that it is positioned in the middle of the page. As before, click the Wrench icon and name this Pane Time and give it a column span of 1.
Click the + (plus) icon to create a Widget for this Pane. In the TYPE dropdown, select Pointer. This type of widget has two values, one determines the direction of the pointer, the other determines the text inside the circular pointer display. To get our clock display working properly, we will use some custom JavaScript code inside the DIRECTION and VALUE TEXT fields. First click the .JS EDITOR button for the DIRECTION field. Copy and paste the JavaScript code below into the window.
// Custom JS for DIRECTION field
// Get the current time
var d = new Date();
// Get the current hours
var h = d.getHours();
// The hour is returned in 24 hour time, to make your clock display 12 hour time,
// change hours over 12 back to under 12.
if(h > 12) {
	h = h - 12;
}
// Get the current minutes
var m = d.getMinutes();

// Figure out the angle (in degrees) that displays the current time like an analog
// clock. Each hour is 30 degrees and each minute is 0.5 degrees.
var a = (30 * h) + (0.5 * m);
// Return the angle
return a;
So what does this code do? Well, the pointer display will act like the hour hand on an analog clock, with the pointer revolving around the circle once every 12 hours. So, this code gets the current hour and minute then calculates the angle around the circle corresponding to this time.
Now click the .JS EDITOR button for the VALUE TEXT field. Copy and paste the code below into the window.
// Custom JS for VALUE TEXT field
//  We need to have a datasource here because the rest of this JavaScript will only be evaluated
// each time the datasource refreshes (every 1 second). If we didn't have this, the time would just
// stay the same and never update.
datasources["Datetime"]["time_string_value"]

var d = new Date();
// Get the current hour
var h = d.getHours();
// The hour is returned in 24 hour time, to make your clock display 12 hour time,
// change hours over 12 back to under 12.
if(h > 12) {
	h = h - 12;
}
// Get the current minutes
var m = d.getMinutes();

// The minutes value is treated as a number, so, for example, at 8:03, the minutes will be returned as
// just 3, and the time would be displayed as "8:3". So, if the minutes value is less than ten, add a
// zero to the front.
switch(m) {
    case 0:
        m = "00";
        break;
    case 1:
        m = "01";
        break;
    case 2:
        m = "02";
        break;
    case 3:
        m = "03";
        break;
    case 4:
        m = "04";
        break;
    case 5:
        m = "05";
        break;
    case 6:
        m = "06";
        break;
    case 7:
        m = "07";
        break;
    case 8:
        m = "08";
        break;
    case 9:
        m = "09";
        break;
}

// Create a string to display the whole time
var t = h + ":" + m;
// Display the time
return t;
This code is simple. It get the current hours and minutes, then displays these values as they would appear on a normal digital clock.
We have just two Panes left to create, and these will be simple. The next Pane we will make is the one that will display the indoor temperature and humidity. the process for creating this Pane will be very similar to the Weather Pane, we will just change the data source. So, add another Pane and position it to the right of the clock. Click the Wrench icon and name the Pane with the location of the Arduino sensor, for example, First Floor Conditions. Add a Widget to the Pane. In the TYPE dropdown, select Text. In the TITLE field, enter <Room Name> Temperature. In the SIZE dropdown, choose Big. Then, in the VALUE field, input datasources["Dweet.io"]["temperature"]. Choose YES for both the INCLUDE SPARKLINE field and the ANIMATE VALUE CHANGES field. Finally, set the UNITS field to match the units specified in the Arduino sketch on line 94.

Then, repeat this same procedure with another Widget but adjust the NAME field as appropriate to say "humidity" in place of "temperature" and in the VALUE field, input datasources["Dweet.io"]["humidity"].

Alright, now let's finish up the Freeboard.io setup with one last Pane. Add another Pane using the ADD PANE button and position it below the Weather Pane. Click the Wrench icon and give the new Pane the title, Inside Light Level, and in the COLUMN field enter 3.
Then add a Widget to the Pane. In the TYPE dropdown select Sparkline. In the TITLE field, enter Inside Light Level. In the VALUE field enter datasources["Dweet.io"]["lightlevel"]. Set the INCLUDE LEGEND field to Yes. Finally, in the SPARKLINE LABELS field, enter Light Level.

Step 15: Set Up a Monitor and Enjoy
Congratulations! Your Arduino IoT Weather Clock is complete. Now all you have to do is set up a display and enjoy your beautiful and useful clock, weather information, and indoor conditions information. You can access your IoT Weather Clock using any device with an Internet browser. You can put it on a computer, a TV, a tablet (I used an old 1st generation iPad I had sitting in a drawer), or even a Raspberry Pi installation.
Thanks for reading!

Participated in the
Time Contest

Participated in the
Tech Contest


