

Introduction: Arduino Spectrophotometer


I'm an amateur astronomer tasked with giving an educational talk to fellow amateur astronomers about how to clean optical surfaces like the lenses of eyepieces and telescopes. I wanted to run a small experiment cleaning some uniform glass samples (that had been coated with dust and mineral deposits) with a variety of commercial and homemade cleaning solutions. But how to quantify the efficacy of the cleaning process?
I decided I could run the glass samples before and after the cleaning process through a spectrophotometer and compare transmission profiles. And one can buy a used student spectrophotometer these days on eBay for a ridiculously low price .... but we all have way too much stuff that we buy, use once and then stash away.
The solution would be to build an Arduino Spectrophotometer, a simple one that did not involve the complex mechanics of a rotating prism (or diffraction grating) and optical slit to deliver monochromatic light to the sample.
Step 1: Materials
Arduino UNO
RGB led
light dependent resistor (photocell)
3 270 ohm resistors
2 10k ohm resistors
breadboard
push button switch
Step 2: Schematic Circuit Diagram
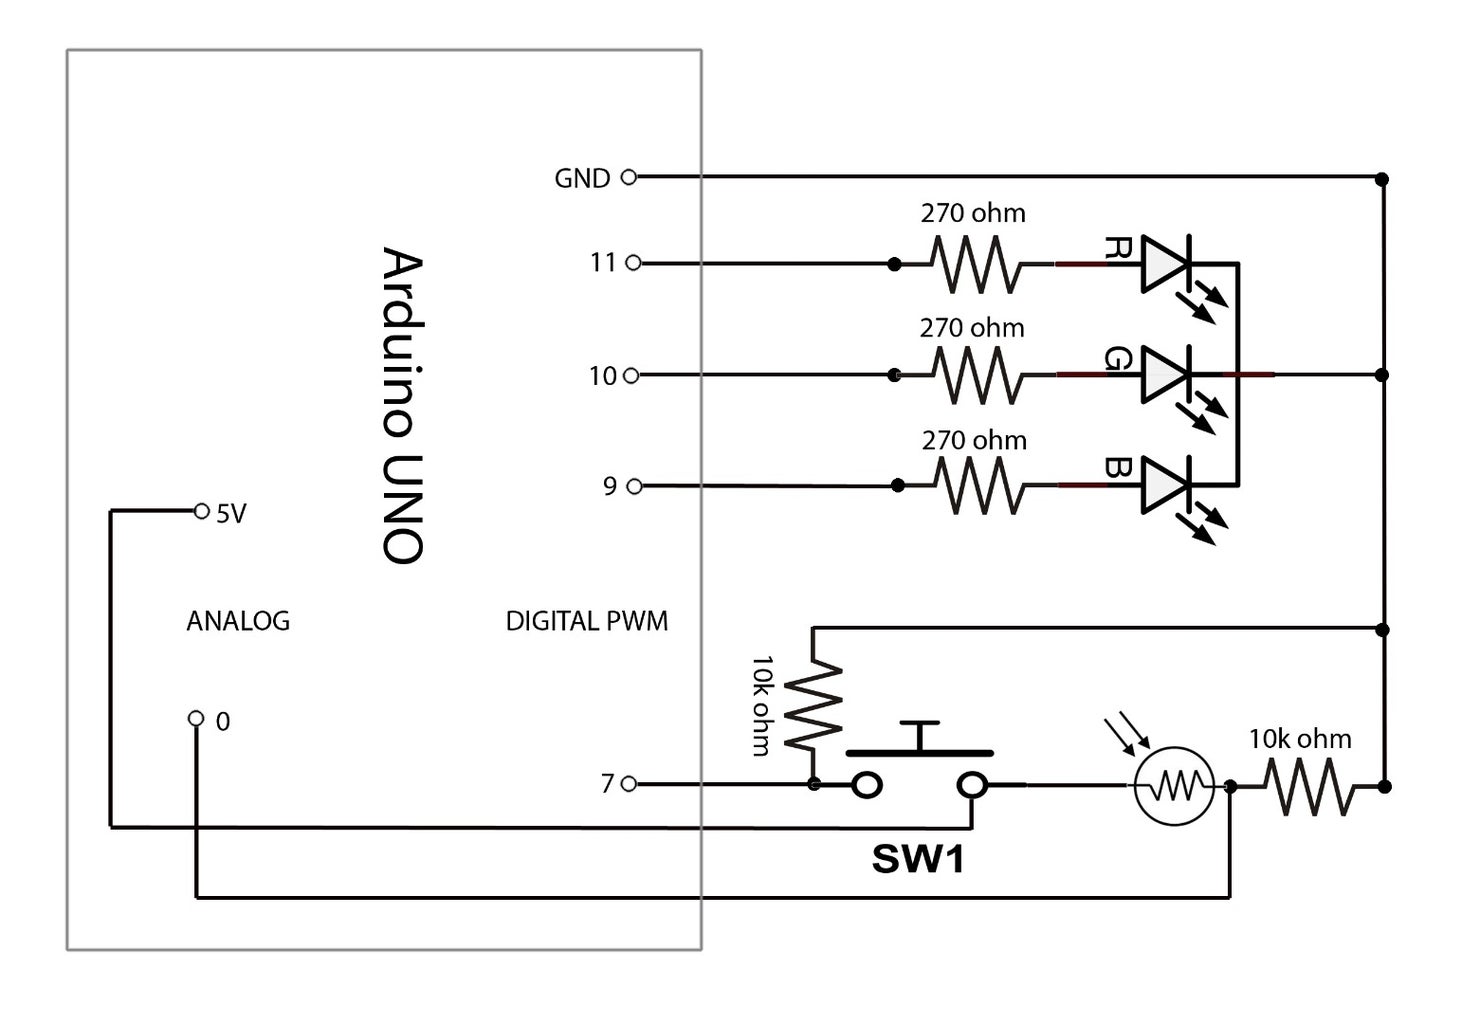
The build is extremely simple because the wavelength of visible light being emitted is entirely digitally controlled by the RGB led. By altering the pulse width modulation values form the UNO to the RGB led you can deliver the primary red, green, blue colors and all the intermediary colors. I tried to keep the level of illumination constant by making the sum of all RGB outputs to a value of 210.
Step 3: Arduino Sketch

The Arduino Sketch is also similarly simple. An array stores all the needed PWM values to deliver the range of visible light from red to blue. The data is output in a CSV compatible form for capture in either a Terminal program to import into Excel or simply cut and pasted directly into Excel from the Arduino Serial Monitor screen.
I've glued the RGB led and photocell in opposite ends of a rectangular piece of polycarbonate plastic. There is a hole drilled between the led and photocell that crosses a slit I cut where my glass samples can be inserted for testing. In the attached image, I placed some translucent red tape folded over a few times to increase opacity into that slot and ran the spectrophotometer. A plastic cover made from black PVC plumbing components is important to allow the spectrophotometer to operate in the dark.
Attachments

Step 4: Red Tape Results
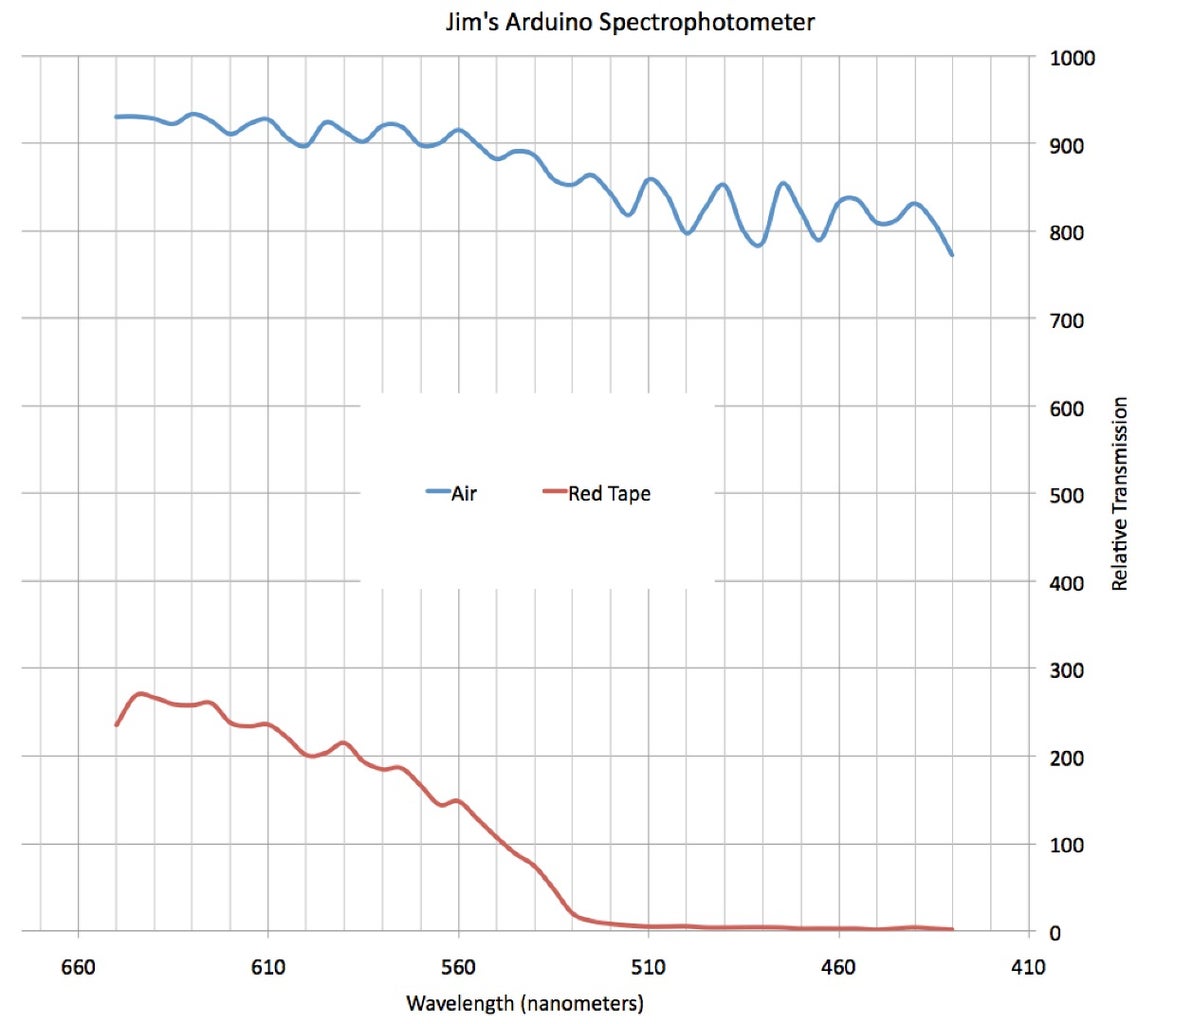

You can see that the transmission profile for just air decreases in the blue part of the spectrum which is expected because typical cadmium sulphide photocells are less sensitive in the blue region.
The transmission profile of the red tape has been normalized to correct for the less sensitive blue region and clearly demonstrates how well this spectrophotometer works!


