Introduction: Arduino Yun - Solar Panel Monitoring System


First of all, please bare with me. This is my first Instructable.
In June 2015 we got our 1kW solar panel system installed. It is an on-grid system, so excessive energy is send back into the public network. We started the process with the local energy supplier Meralco to get registered for “net-metering”. “Net-metering” means that we get paid for energy that we send back into the public network. But we stopped in the middle of the process, because it was tiring, complicated and the additional requirements (additional breaker, evtl. additional watt meter, updated electrical plan by a certified electrician, ...) would have cost us a lot of money.
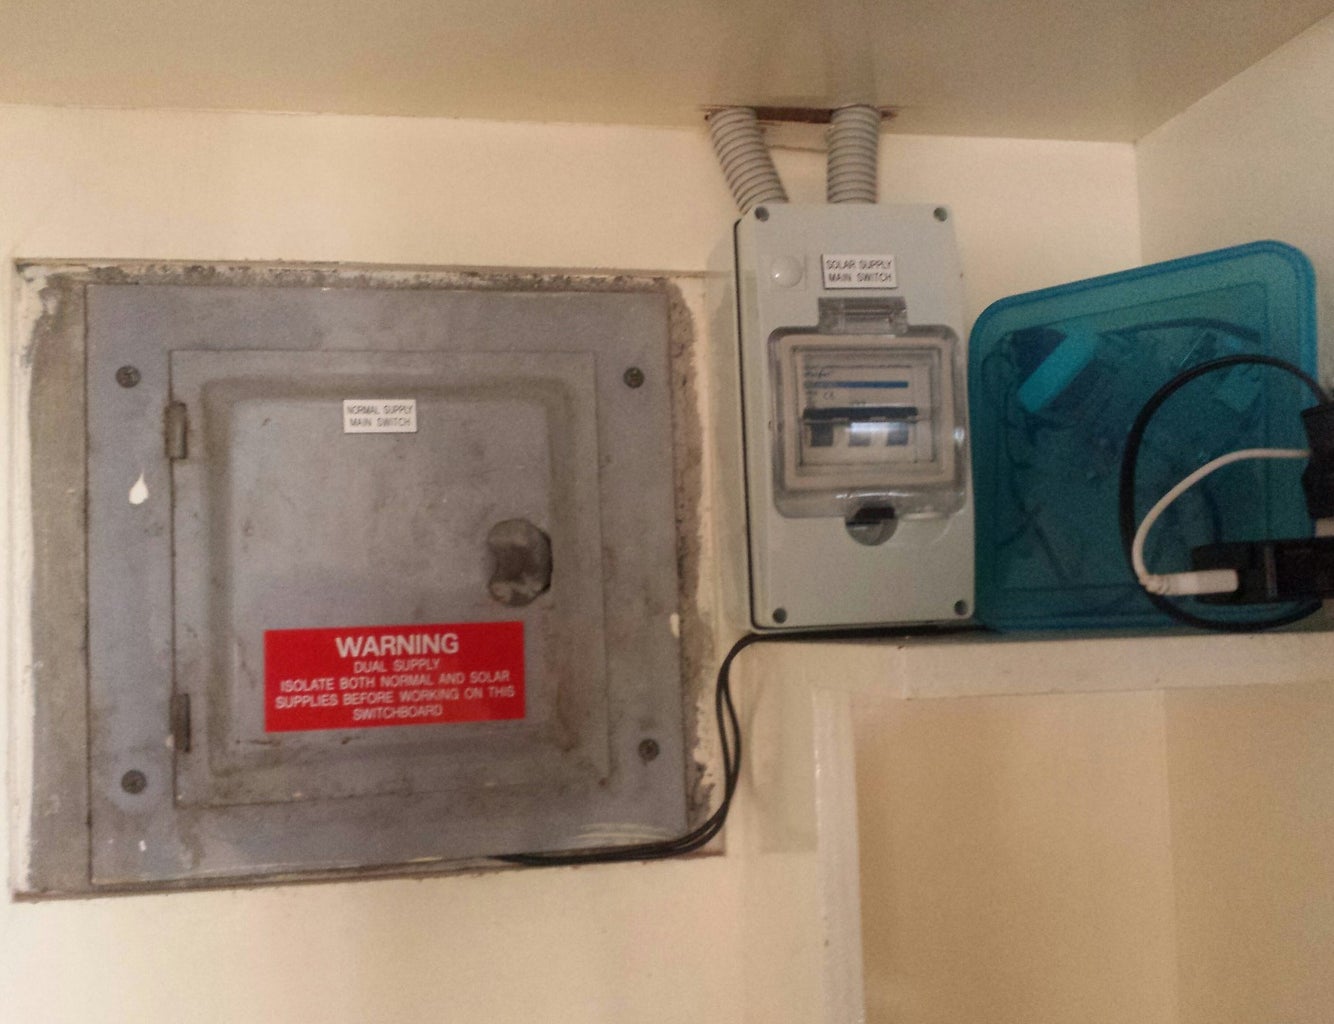
Without having net-metering we are invoiced for every kWh that is send back to the net as if we have consumed it. The net meter counting our consumption is a modern digital style, he shows whether we are consuming energy from the net or if we are sending out energy. (See image above).
Inside the red rectangle the net meter says either Receiving (energy supplier is receiving energy from us) or Delivered (we receive energy from the the energy supplier). But the counter goes up in both situations.
As we have only a small 1kW system and we are at home during the day we decided to just adjust our energy consumption so that we do not push back too much energy into the public network. But how to know if the solar system is producing more energy than we are consuming? The supplier of the micro inverters offers a monitoring system. But the cost is 10% of what we paid for the whole system. Too much! And on top it is a proprietary system, using power line communication but the protocol is not available (One of the things I hate in this world!). To monitor we are limited to use our web browser and get the data from the companies web server, where they store all the information they receive from our system. So I started searching on the internet for an alternate solution to monitor our power consumption and production. The best site I found is: OPENENERGYMONITOR.
Everything I did on the monitor system side I could only do with the information, source codes and hardware explanations I found on their site. And when I got stuck, their forum is very helpful for research and to get answers.
I decided to build up my own system instead of buying a pre-built system from their shop. The monitoring system can be split into 3 parts:
- An Arduino based measurement system
- The necessary sensors
- A Linux based web server
- An Android application to visualize the data.
Luckily for 1) and 3) only one device is necessary. This is possible with the Arduino Yun
This nice small and affordable piece of electronic has an 8bit Atmel AVR ATmega32U4 microcontroller to do real-time measurement and in addition a Linux system based on the Atheros AR9331. The Atheros runs a Linux distribution based on OpenWrt named OpenWrt-Yun. The board has built-in Ethernet and WiFi support and a SD card slot. Perfect for IoT solutions. Of course the web server has limited performance, but for my requirements it is sufficient. The built-in Ethernet and WiFi gives the connectivity needed and the SD card provides the storage to save the recorded data in a database.
The Android application 4) was developed from scratch, but thanks to STACKOVERFLOW it was no problem to find the necessary libraries and answers to upcoming problems during the development..
For the sensors and the Arduino board I found Circuit-Help as a reliable and customer friendly company here in Manila! A list of all parts used in this project can be found on the last post of this series. All schematics and source code can be found on my Github repository spMonitor.
Now head over to the next step, where I explain the measurement electronics.
Step 1: SOLAR PANEL MONITORING – HARDWARE


This step will go into details of the used hardware.
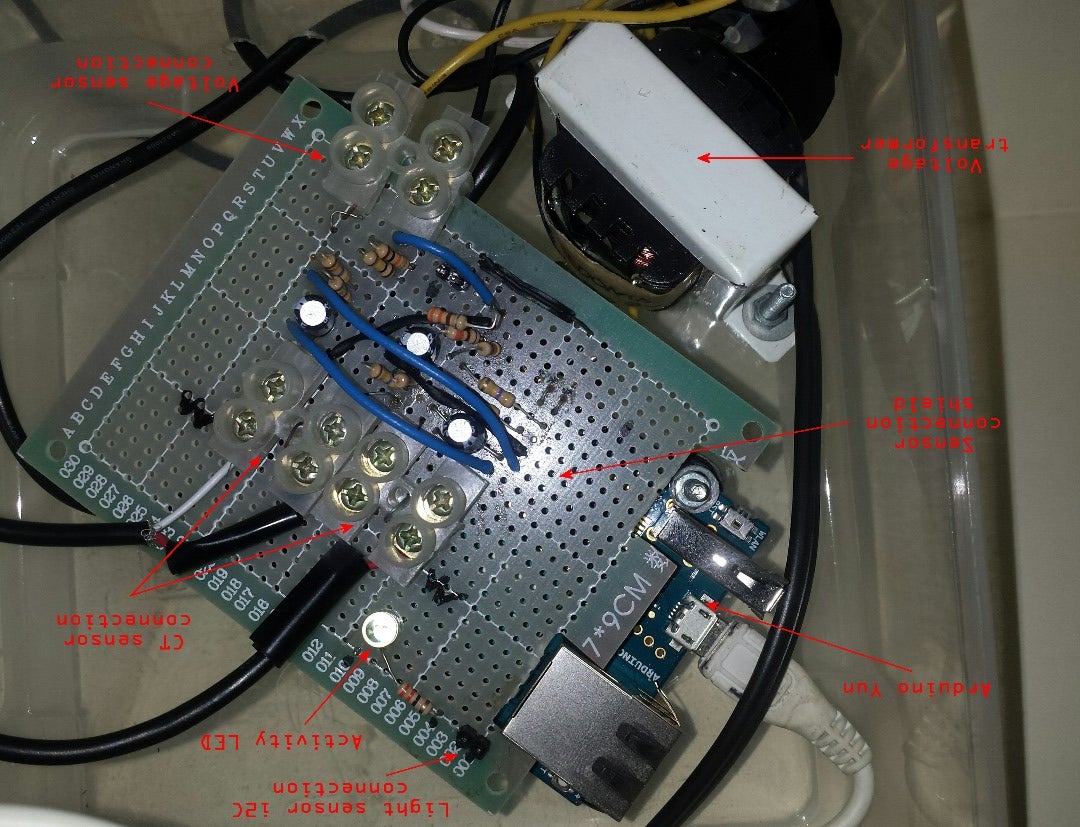
To connect the different sensors I build a “shield”. In the Arduino world a shield is an extension board that is plugged on top of an Arduino board. The Arduino has most of the analog input ports, digital I/O ports and communication ports on headers located on the side of the board.
The sensor connection shield I build to connect the different sensors is plugged into these headers.
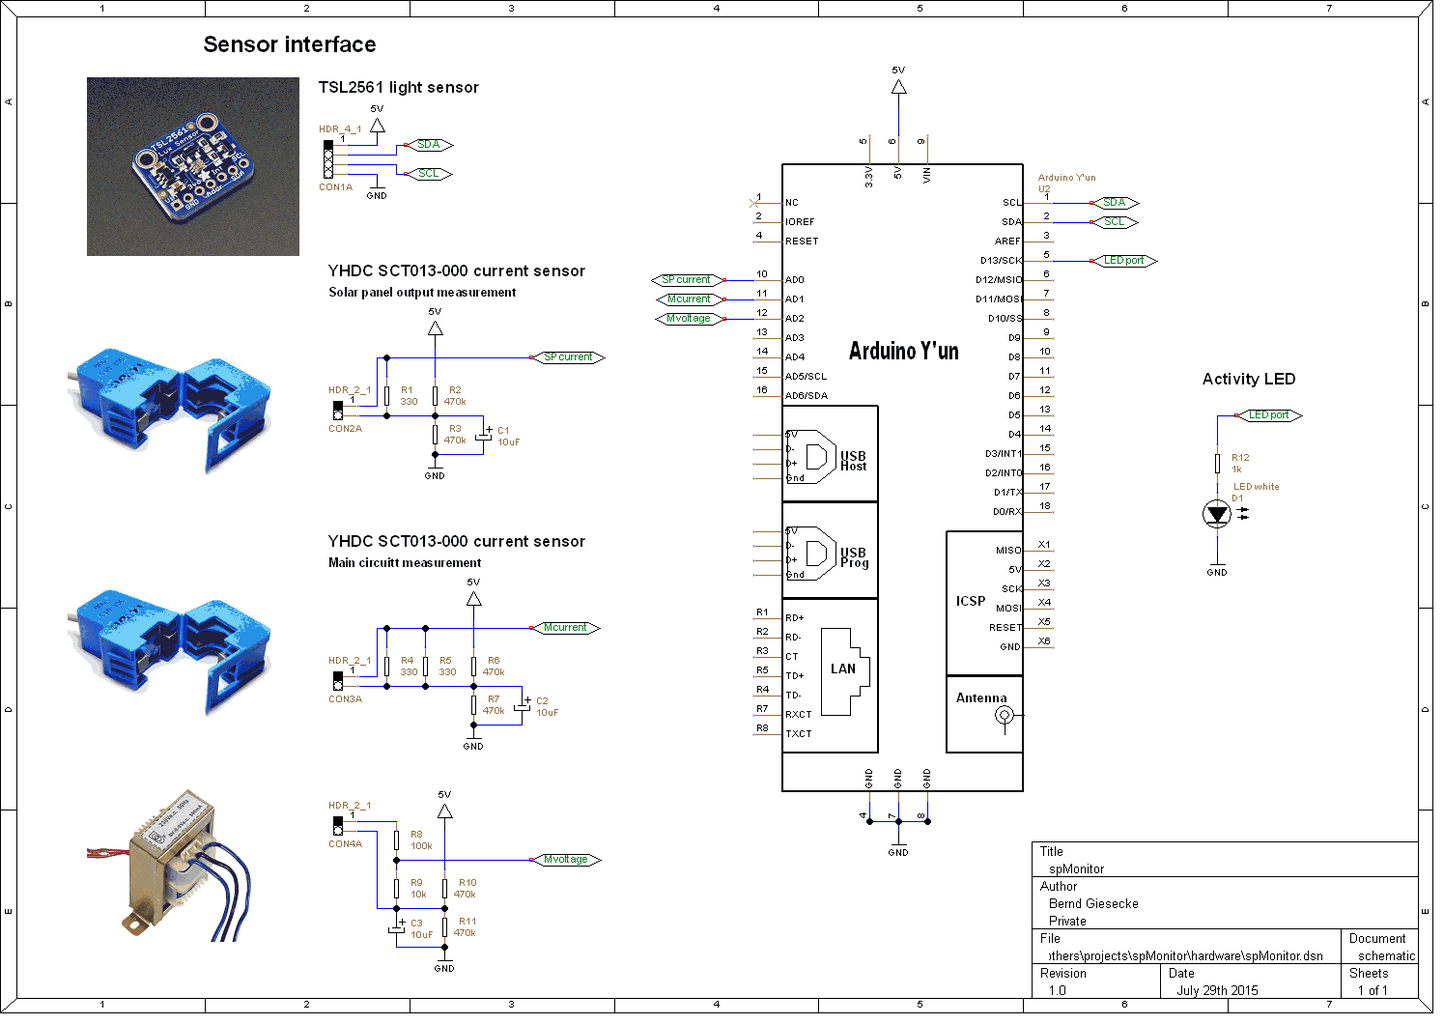
For the current measurement 2 CT (current transformers) are needed. One is measuring the current coming from the solar panels, the second one is measuring the house main line current. For calculation of the power the voltage is measured as well with a voltage transformer. I plan as well to mount a light sensor next to the solar panels. The light sensor will be connected with an i2c serial connection. But for now this is not implemented.
The Arduino analog input ports accept a maximum voltage of 5V. Therefor the analog signals must be adapted by a circuit to match with these specifications.
OpenEnergyMonitor has very good tutorials for connection the CT sensors (including calculation of burden resistors and calibration values) in their CT sensors – Interfacing with an Arduino building block. The only CT sensor I could find was a 100A type (YHDC SCT-013-000). As my currents are not reaching 100A, I re-calculated the burden resistors to match my requirements. For the main line I used a 165 Ohm burden resistor, which allows a maximum measurement of 20A which is more than enough for our house consumption. For the solar panels I chose a 330 Ohm burden, which allows a maximum of 10A, which is more than enough for a 1kW system. For calculation of the burden resistors please check the link to the OpenEnergyMonitor building block.
For the voltage measurement circuit I found as well a tutorial at OpenEnergyMonitor. Check out the Measuring AC Voltage with an AC to AC power adapter building block. Instead of using a AC/AC wall plug I decided to get a cheap 220V/9V voltage transformer and integrate it into the box with the Arduino hardware.
For the light sensor I chose a module from Adafruit. This module has the advantage that it has two sensors which are measuring the visible and IR parts of the light. The light sensor communicates with the Arduino over an i2C interface. The pins of the sensor are directly connected to the Arduino header pins.
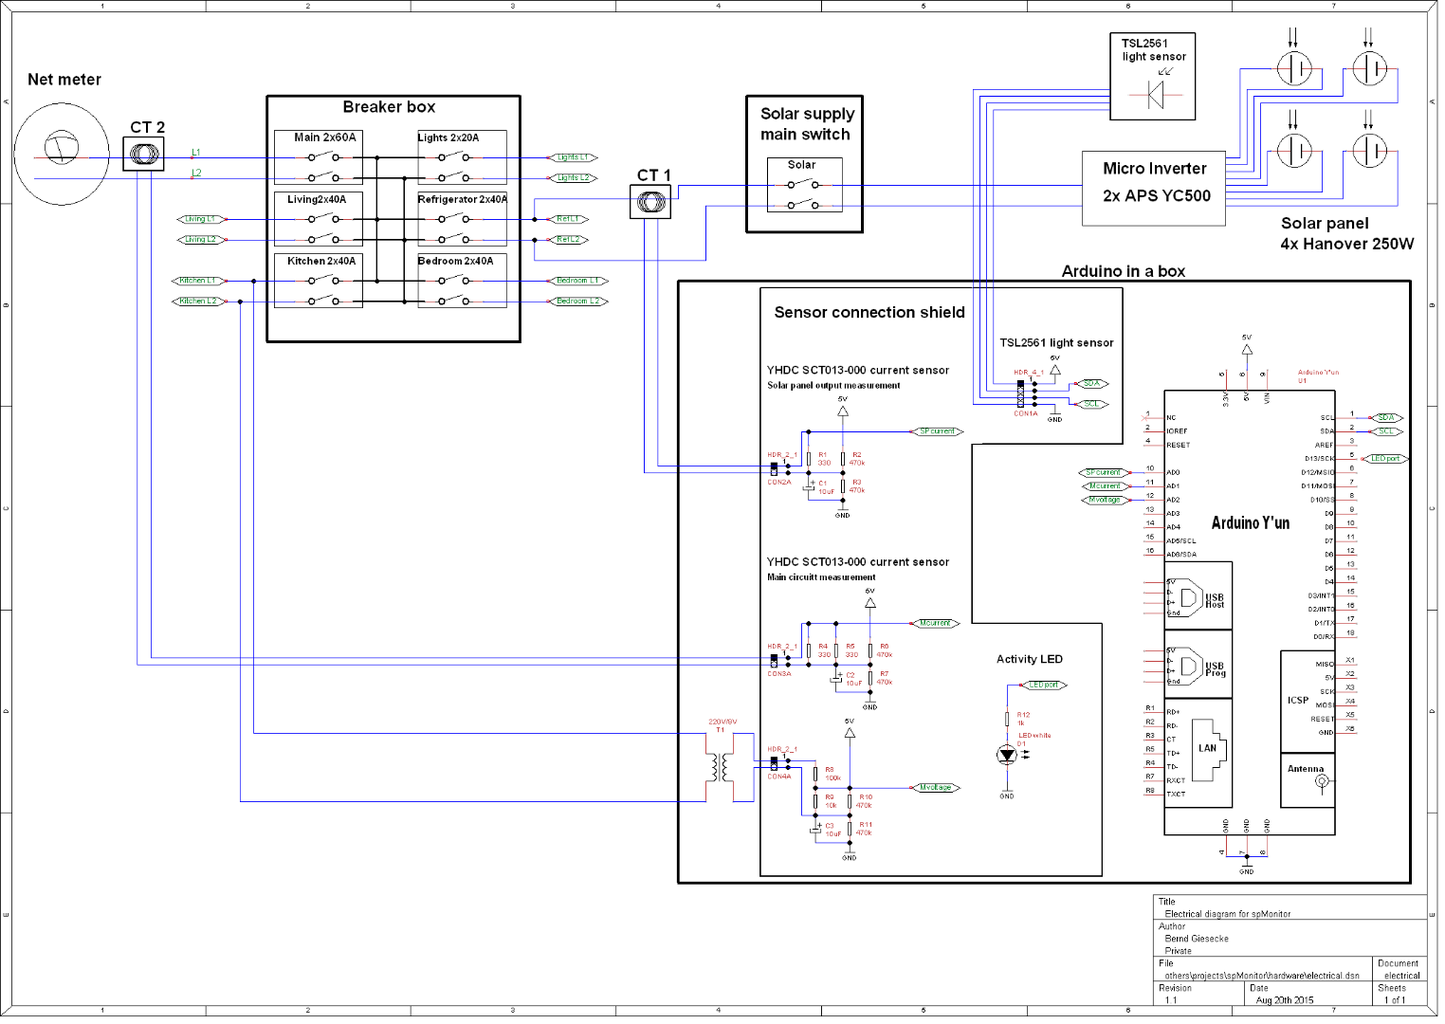
The full circuit schematic is shown above. Basically it is not very complicated.
Step 2: SOLAR PANEL MONITORING – ELECTRICAL INSTALLATION


This is the part where you might want to ask an electrician for support. The system uses non-invasive CT sensors to measure the current. So we do not have to temper directly with the 240V (or 110V) lines. But still we have to open the breaker box and clip the sensors around the hot wires.
Depending on your installation, you might have a separate main breaker, so you can shut off power while you are working on the breaker box. In my case, there is no separate main breaker. So while I was clipping the sensor on the main line, I was away only a few centimeters from 240V with my fingers. Don’t take any risk, if it seems to be difficult to clip on the sensors, ask an trained electrician to do it. The CT sensors are easy to use. You do not need to connect 240V wires, you just clip the sensor around a single wire. It is important that you clip it around a single wire only, or the sensor will not work. Follow strictly the advices on OpenEnergyMonitor Current Transformer Installation building block.
Locate the wires coming from your solar panel system and clip one sensor around one of the wires.
Locate the main line coming into your house and clip the other sensor around one of the wires. For 3 phase systems or split phase 240V systems (like in US) please check the OpenEnergyMonitor website. You can find there help how to setup a system for 3 phase or split phase power supply. In my case it is a “standard” Philippine supply, which is 2 wires single phase 240V system. So I needed only one CT around the main wire and one CT on the solar power supply.
Next step is to find a place for the Arduino board, the sensor connection shield and the voltage transformer. In my case there was no space inside the breaker box, so I had to place it outside. I exit the cables from the CT sensors out of the breaker box. For the measurement electronics I used a plastic box with lid (as used to store food). Don’t laugh about this, but such a box is very cheap and can be found in different sizes matching your requirements. It gives me a view to the electronics inside (and the activity led), and after sealing the holes I put in for the cables, I have a sealed box for only a few bucks.
Then the wires from the CT sensors are connected to the “sensor connection shield”. Hopefully you have marked the cables coming out of the breaker box. The transformer for the voltage measurement is mounted inside the ‘lunch’ box as well. It needs to be connected to the “sensor connection shield” on the 9V side and to a plug on the 220V side. I soldered a cable with a standard plug directly to the transformer and exit this cable from the box. The supply for the Arduino board is done with a standard micro USB plug. After all the wires and cables going in and out of the ‘lunch’ box have been places, the box can be closed.
The power for the measurement system is provided by a 5V USB charger. Don’t use the cheapest USB charger you have laying around. I tried 4 different USB chargers before I found one that gives a stable 5V supply with low noise level. Most USB chargers are designed poorly. For battery charging you do not need a high quality low noise 5V. But for measuring low currents (like we do with the CT’s) noise on the supply line can make measurements at low consumption very unreliable as the noise could be bigger than the signal we want to measure. Search on OpenEnergyMonitor for this issue. I had a discussion about this on their forum.
I did not mention the installation and connection of the light sensor module. The module is ready, but I need to find a water proof transparent box before I can mount the sensor on the roof next to the solar panels. Until I found a solution for the box the light measurement is on hold.
The complete schematic for the installation of the system is in the images above.
Step 3: SOLAR PANEL MONITORING – SETUP ARDUINO YUN SYSTEM


I will not explain the initial setup of the Arduino Yun here. You can find good tutorials on the web about this. What you need to remember is the username, password and IP address you assigned to the Arduino board during the initial setup. I recommend strongly to apply a fixed IP address to the board to make communication easier.
The Arduino Yun is basically two independent systems on one board. You have an 8bit AVR micro controller and a Linux system based on the Atheros AR9331. The Atheros runs a Linux distribution based on OpenWrt namedOpenWrt-Yun (Aka Linino). I use the AVR controller for the measurement of currents, voltage and light. This data is then transferred to the Atheros system which performs the communication part to distribute the data. The communication between the AVR and the Atheros is done by a serial connection and a software called the “bridge“. There are several tutorials on the web that explains how the two systems communicate with each other using the “bridge“. I will explain only the few functions of the “bridge” I use in this application.
VERY FIRST IMPORTANT STEP BEFORE WE GO ON.
The memory of the Linux system is limited. Therefor it is recommended to expand the memory by using a SD card. Detailed steps can be found at How to expand the Yún disk space. Please follow this tutorial before going on with the next step.
ADDITIONAL SOFTWARE NEEDED ON THE LINUX SYSTEM
The standard installation of the OpenWRT-Yun is missing some functions that we need for this application. For storage of the data we use Sqlite, for the communication we use PHP5 and for displaying the recorded data we use GD. Some of these moduls are missing and need to be installed. To do this we need a SSH connection to the Linux system. A SFTP connection to transfer some files will be helpful as well. As my development system is Windows, I use Bitvise SSH client which provides both the SSH terminal and the SFTP client. If you are using Linux or MacOS, then you need a similar tool.
First open a SSH connection to the Arduino Linux. Then install the necessary packages with opkg:
opkg update
opkg install openssh-sftp-server
opkg install php5 php5-cgi php5-mod-gd php5-mod-json php5-mod-pdo php5-mod-pdo-sqlite php5-mod-sqlite
opkg install libsqlite3 sqlite3-cli
After installation it is necessary to change some settings for PHP and the UHTTPD server. Edit /etc/php5.ini and enable the following extensions:
extension=gd.so
echo "extension=json.so
echo "extension=pdo_sqlite.so
echo "extension=sqlite3.so
Edit /etc/config/uhttpd as well and change the following lines:
list interpreter ".php=/usr/bin/php-cgi"'
echo "option max_requests 10"
After that restart the web server with
/etc/init.d/uhttpd restart
CREATE THE DATABASE
The easiest way is to copy the file create.sql to the root of the SD card with SFTP. The file can be found in my Github repository. Then use SSH and enter the following commands:
cd /mnt/sda1
sqlite3 s.db < create.sql
This creates an empty Sqlite database on the root of the SD card. The database has one table named “s” and four columns named
id => record id
d => text field containing the date and time stamp of the record
s => power produced by the solar panel
c => power consumed by the house
l => light value
This database will be filled with records from the AVR micro controller and accessed by PHP pages to transfer or display the records.
PHP SCRIPTS
The PHP pages to access the data from a local network or to display the data in a web browser will be automatically uploaded when you install the Arduino sketch on the board. To achieve this the PHP pages must be located in a folder called www in the path where the Arduino sketch files are saved. If you clone my Github repository the files will be automatically placed in the correct folder.
That’s all setup to be done on the Linux side to access the data from a local network.
Go to the next step to see what is done within the PHP pages.
Step 4: SOLAR PANEL MONITORING – PHP PAGES


The system uses 3 PHP pages and a graphic library for the communication and display of the data.
PHPINFO.PHP
This PHP page is only to check the setup of the PHP configuration on the Linux server. It is not required for daily operation. When you open “IPADDRESS/sd/spMonitor/phpinfo.php” (replace IPADDRESS with the IP address you assigned to your Arduino board) you can see the standard PHP info. Important is that the following packages are available:
PHP Version 5.6.6 (must be newer than version 5.5)
GD Support -- enabled
GD Version -- bundled (2.1.0 compatible)
json support -- enabled
PDO drivers -- sqlite
SERVER_SOFTWARE -- uHTTPd
INDEX.PHP
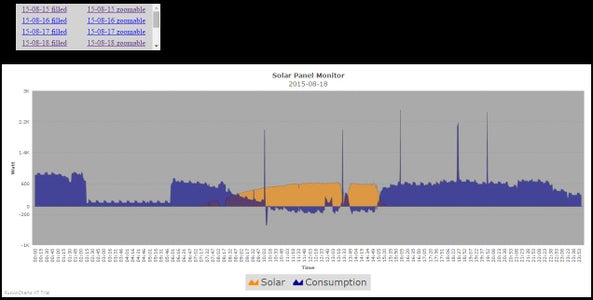
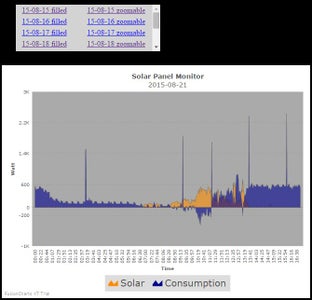
When I started this project my main target was to use Android phones/tablets to display the recorded data. But for initial testing I created a very primitive web page that shows the recorded data on a web browser. This is achieved with index.php. The layout of the webpage is very simple. At the top is a scroll box that shows all available records organized by day.
For every day there are 2 options:
YY-MM-DD-filled => displays all records of the day DD at the month MM in the year YY in a graph.YY-MM-DD-zoomable => displays all records of the day DD at the month MM in the year YY in a graph that can be zoomed in and out horizontally and vertically. (See above images for the different graph types).
The date that will be displayed after clicking on a link in the list is send to the PHP page with the parameter day=15-08-21. The second parameter type=zoomline(or filled) defines which type of graph is displayed. To draw the graph I use the FusionCharts library with their PHP wrapper. FusionCharts offers a free (unlimited) trial version. It only shows a watermark on each graph. But if you want to use it in commercial applications you need to buy a license. I will not go into details how to use the library. You can check the file index.php to see how I create the plot.
QUERY.PHP
This PHP page is used from the Android application to send a query to the Sqlite database on the Arduino board and receive the output as a JSON string. The query is initiated with a call to “IPADDRESS/query.php?date=param1&get=all” (replace IPADDRESS with the IP address you assigned to your Arduino board). The first parameter “date” sets the limiter for the query:
yy- ~> all from year yy
yy-mm -> all from year yy and month mm
yy-mm-dd => all from year yy, month mm and day dd
yy-mm-dd-hh => all from year yy, month mm, day dd and hour hh
yy-mm-dd-hh:MM => all from year yy, month mm, day dd, hour hh and minute MM
The second parameter “get=all” tells the script if all entries newer as defined in “date” should be sent as well.
Examples:
date=13-08-16-20&get=all returns the rows of 13-08-16 at 20 o'clock and all rows after that
date=13-08-16-20 returns only the rows of 13-08-16 from 20:00 until 23:59 but not of the next day
date=13-08-16&get=all returns the rows of 13-08-16 and all rows after that
date=13-08-16 returns only the rows of 13-08-16 from 00:00 to 23:59 but not of the next day
The key points of the PHP script are:
$query = $query . " WHERE d LIKE '" . $dateSelect . "%'";
which gets all rows where “d” contains the substring $dateSelect and
$query = "SELECT * FROM s where id>" . $lastID;
which gets all rows that are newer than the last row found in the first query.
The data submitted from the database by these two queries are then encoded as a JSON array and sent back to the requesting client.
echo json_encode($json);
Have a look on query.php to see more details.
That’s it about the PHP pages.
Step 5: SOLAR PANEL MONITORING – ARDUINO SKETCH

Writing a program for the Arduino was a new experience for me. Spoiled by Windows/Linux and even Android which have basically no memory limit I run very soon into problems with the very limited code and variable space on the Arduino boards. The Arduino Yun offers only 28,627 bytes for code and 2560 bytes for global variables.
What I learned fast was that I can use up the code memory up to 99.9%, but if I use more than 60% of the memory for global variables the sketch was no longer working reliable. I think the underlaying code (bootloader, …) requires some free space int global variables memory. So I had to optimize my code and limit usage of global variables as much as possible. For the code itself, I split the Arduino sketch into several files. I tried to comment the code as good as possible, so it should be self explanatory.
spMonitor.ino = dummy file with description of the other files<br>spMonitor_a_definitions => includes and global variables
spMonitor_b_utils => utility functions
spMonitor_c_lightsensor => interface to TSL2561 light sensor
spMonitor_x_measurement => measurement functions
spMonitor_y_setup => Arduino setup function
spMonitor_z_loop => Arduino loop function
The names of the files follow a specific scheme. The compiler for the sketch requires that sub-functions used must be declared before they are used. So the file names are SKETCHNAME_index_MODUL. With the index I get the files to be compiled in the correct sequence.
SPMONITOR_A_DEFINITIONS
In the first part all the external files necessary for the different functions are included.
Wire.h => i2c communication library<br>Adafruit_Sensor.h, Adafruit_TSL2561_U.h and pgmspace.h for the light sensor
EmonLib.h for the CT and voltage sensors
FileIO.h to access the SD card of the Linux part of the board
YunServer.h and YunClient.h for the web communication
avr/wdt.h for the watchdog implementation
Calibration values:
/** iCal definition for CT 1 (solar) */<br>#define iCal1 5.7
/** iCal definition for CT 2 (mains) */
#define iCal2 11.5
/** Phase shift definition for voltage (solar) */
#define pShift1 1.3
/** Phase shift definition for voltage (mains) */
#define pShift2 6.1
/** vCal definition for voltage measurement */
#define vCal 255
These values are crucial for the measurements. These values are depending on the CT sensors used, tolerances of the used resistors and capacitors and other things. To get these values correct, I stepped several times through the calibration guide of OpenEnergyMonitor building block Calibration Procedure. Until you have the correct values here all your measurements will be more or less CRAP! To make the calibration possible without writing a special script I included a “calibration mode” into the Android application. When the calibration mode is activated the Android applications pulls data from the Arduino every 10 seconds and displays details about the power factor, real and apparent power and measured voltage. The calibration values can then be changed until the values are as expected (e.g. power factor close to 1.o).
The other global variables are well commented.
SPMONITOR_B_UTILS
This modul contains 2 functions used to store the recorded values.
String getTimeStamp() returns the current date and time of the system. To get it we use the “bridge” function “.run” to run a command on the Linux side and receive the output over the “bridge“.
/** Instance to Linino process */<br>Process time;
/* date is a command line utility to get the date and the time */
/* in different formats depending on the additional parameter */
time.begin ( "date" );
time.addParameter ( "+%y,%m,%d,%H:%M" );
wdt_reset();
time.run(); /* run the command */
The possibility to start commands and scripts on a Linux shell extends the capabilities of the Arduino board. Instead of the problems to add complex functions into the limited program space of the AVR controller they can be delegated to the Linux part.
void saveData () uses the “bridge” functions as well to write the collected data into a database, send it to an cloud web service and store it for easy access on the Linux side.
The measurements are done every second, but the values are stored only every minute. The measured values are stored in an accumulator. The code part
/** Light value collected since last saving */
long light = 0;
if ( collCount[2] != 0 ) {
    light = collLight / collCount[2];
}
/** Solar power value collected since last saving */
double solar = collPower[0] / collCount[0];
/** Consumed power value collected since last saving */
double cons = collPower[1] / collCount[1];
calculates the average of the measurements done since the last saving of values.
The code part
Bridge.put ( "L", String ( light ) );
Bridge.put ( "S", String ( solar ) );
Bridge.put ( "C", String ( cons ) );
stores the measured values on the Linux processor using a Key/Value structure. These structure can be retrieved as a JSON string by simple calling “http://IPADDRESS//data/get”. (IPADDRESS is the IP address assigned to the Arduino Yun). The data looks like:
{
    "value":
    {
        "c":"2.56",
        "L":"0",
        "sv":"219.43",
        "cv":"215.85",
        "cp":"0.97",
        "sa":"100.44",
        "ca":"553.57",
        "cr":"539.18",
        "C":"596.05",
        "s":"0.46",
        "S":"0.00",
        "sp":"0.20",
        "l":"0",
        "sr":"0.00"
    },
    "response":"get"
}
You can see the data we put with the above code part in this JSON string.
The L, S and C value is updated every minute and used to update the UI in the Android app. The c, cv, cr, .. values are updated after every measurement cycle (~1s) and can be used during the calibration mode. They are as well shown on the UI of the Android app. The next code part
/** Instance to Linino process */
Process sqLite;
timeString = getTimeStamp();
timeString.replace(',', '-');
dataString = "sqlite3 /mnt/sda1/s.db 'insert into s (d,s,c,l) Values (\""
+ timeString + "\","
+ String ( solar ) + ","
+ String ( cons ) + ","
+ String ( light ) + ");'";
sqLite.runShellCommand ( dataString );
uses the “bridge” function “.runShellCommand” to write the measured values into the Sqlite database. From there they can be retrieved over the local network with the query.php script.
And the last code part
/** Instance to Linino process */
Process emonCMS;
dataString = "curl \"http://emoncms.org/api/post?apikey=ENTER_YOUR_OWN_API_KEY_HERE&json={s:";
dataString += String ( solar );
dataString += ",c:";
dataString += String ( cons );
dataString += ",l:";
dataString += String ( light );
dataString += "}\"";
emonCMS.runShellCommand ( dataString );
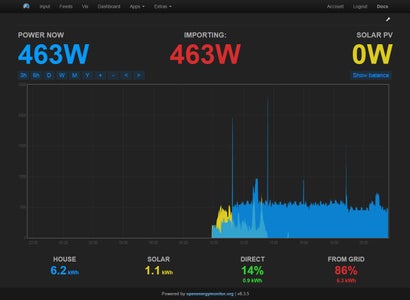
uses as well the “bridge” function “.runShellCommand” to send the data to a cloud web service. This cloud web service emoncms.org offers (at the moment for free) the possibility to store sensor data and visualize them on the web. Check their service, they are powered by OpenEnergyMonitor!
I added one of the visualization options into the images above. You can see the real consumption/production data of my house in the My Solar app of emoncms.org.
SPMONITOR_C_LIGHTSENSOR
This modul handles the light sensor. The communication with the light sensor is done within the Adafruit_Sensor and Adafruit_TSL2561_U libraries. These libraries are available as open source from Adafruit, the manufacturer of the light sensor module.
void configureSensor () initiates the auto range function of the light sensor and sets it integration time to the highest value.
void readLux () initiates a measurement on the light sensor module. To adapt to different light intensities it is necessary to adapt the integration time of the sensor. Initially the sensor is set to the highest integration time which is the best in low light situations. But if the light gets brighter, the sensor will saturate and it is necessary to switch to a shorter integration time. The sensor offers 3 different integration times. The code part
/* Display the results (light is measured in lux) */
if ( event.light ) {
    /** Int value read from AD conv for sun measurement */
    accLux += event.light;
    lightOk++; /* Increase counter of successful measurements */
    if ( lightInteg == 1 ) { /* we are at medium integration time, try a higher one */
        tsl.setIntegrationTime ( TSL2561_INTEGRATIONTIME_402MS ); /* 16-bit data but slowest conversions */
        lightInteg = 2;
    } else if ( lightInteg == 0 ) { /* we are at lowest integration time, try a higher one */
        tsl.setIntegrationTime ( TSL2561_INTEGRATIONTIME_101MS ); /* medium resolution and speed   */
        lightInteg = 1;
    }
}
reads a value from the sensor. If the sensor delivers a value, the code switches to a higher integration time.
But if the sensor is already saturated, we lower the integration time and try again to read from the sensor
} else {
    /* If event.light = 0 lux the sensor is probably saturated
                          and no reliable data could be generated! */
    if ( lightInteg == 2 ) { /* we are at highest integration time, try a lower one */
        tsl.setIntegrationTime ( TSL2561_INTEGRATIONTIME_101MS ); /* medium resolution and speed   */
        wdt_reset();
        tsl.getEvent ( &event );
if ( event.light == 0 ) { /* Still saturated? */
lightInteg = 0;
tsl.setIntegrationTime ( TSL2561_INTEGRATIONTIME_13MS ); /* fast but low resolution */
wdt_reset();
tsl.getEvent ( &event );
if ( event.light != 0 ) { /* Got a result now? */
accLux += event.light;
lightOk++; /* Increase counter of successful measurements */
}
} else {
lightInteg = 1;
accLux += event.light;
lightOk++; /* Increase counter of successful measurements */
}
} else if ( lightInteg == 1 ) { /* we are at medium integration time, try a lower one */
lightInteg = 0;
tsl.setIntegrationTime ( TSL2561_INTEGRATIONTIME_13MS ); /* fast but low resolution */
wdt_reset();
tsl.getEvent ( &event );
if ( event.light != 0 ) { /* Got a result now? */
accLux += event.light;
lightOk++; /* Increase counter of successful measurements */
}
}
}This loop is repeated 5 times to adapt to changing light situations.
SPMONITOR_X_MEASUREMENT
This modul contains the CT sensor measurement routines. The direct measurement of current and voltage is done by the emonLib library. EmonLib is an open source library provided by OpenEnergyMonitor.
void getCTValues (int index) calls emonLib to initiate the measurement of current, voltage and calculation of power and power factor. The parameter index determines the sensor that should be read. index = 0 starts a measurement of the CT sensor attached to the solar panel wire, 1 starts a measurement of the CT sensor attached to the main power line.
/* Get the measured current from the solar panel */
emon[index].calcVI(20, 2000);
/** Measured power in W */
double power = emon[index].realPower;
The collected values are then stored in an accumulator. At the moment the system is able to make a measurement around every second. The values stored in the accumulator are used to calculate an average value before saving the values in the database, which is done every 60 seconds.
collPower[index] = collPower[index] + power;
collCount[index] += 1;
At night the solar panel is not producing power, but it is using a small standby current. We eliminate this standby current with the code
/** Sensor 0 is measuring the solar panel, if it is less than 20W then mostlikely that is the standby current drawn by the inverters */
if ( emon[index].Irms < 0.55 ) {
    power = 0.0;
}
This way we make sure that we do not record a not existing power production during night.
The measured values are then saved on the Linux side with the “Bridge.put” function as a Key/Value structure. The keys are created by using the prefix s for values from the solar sensor and the prefix c for values from the main line sensor.
Bridge.put ( prefix, String ( emon[index].Irms ) ); // Current
Bridge.put ( prefix + "r", String ( power )  ); // Real power
Bridge.put ( prefix + "v", String ( emon[index].Vrms ) ); // Voltage
Bridge.put ( prefix + "a", String ( emon[index].apparentPower ) ); // Apparent power
Bridge.put ( prefix + "p", String ( emon[index].powerFactor ) ); // Power factor
SPMONITOR_Z_LOOP
This is the programs main loop. It is running all the time. Inside the loop we use the millis() function to initiate measurements and saving of values in specific frequencies.
At the moment the measurement is initiated every second. This is possible because the light sensor is not used yet. Once the light sensor is attached the frequency of the measurement has to be reduced, as the routine for the light measurement can take more than 2 seconds worst case.
/** Actual time in milliseconds since start of spMonitor */
unsigned long now = millis();
if ( now - lastMeasure >= measureFreq ) { /* initiate measurement every 1 seconds */
    lastMeasure = now;
    wdt_reset();

    /* Activity LED on */
    digitalWrite ( activityLED, HIGH );

    wdt_reset();
    /* Get the light measurement if a sensor is attached */
    readLux();

    /* Get the measured current from the solar panel */
    getCTValues(0);

    /** Get the measured current from mains */
    getCTValues(1);

    /* Activity LED off */
    digitalWrite ( activityLED, LOW );
}
This code calls the measurement functions for the CT sensors and the light sensor. The measurement cycle is visualized by an LED mounted on the sensor connection shield.
The following code calls the function to save the values into the database every minute:
if ( now - lastSave >= 60000 ) { /* Save data every minute */
    lastSave = now;
    wdt_reset();
    saveData();
}
And finally we have a code part to communicate directly over the local network with a PC or Android device. When I started with the application, I tried to have all communication handled within this Arduino code, but due to the memory limitations I realized that this was not possible. So at the end there is only one function left here. As most communication parts are delegated directly to the Linux part of the Arduino board only the status report function is handled here.
/* There is a new client? */
if ( client.available() ) {
    wdt_reset();
    /** Character holding the command that was sent */
    char command = client.read();

    if ( command == 'e' ) { /* Get the actual settings */
        client.print ( "F " + String ( measureFreq ) + "s" );
        client.println ( " V " + String ( vCal ) );
        client.print ( "C1 " + String ( iCal1, 1 ) );
        client.println ( " C2 " + String ( iCal2, 1 ) );
    }

    /* Close connection and free resources. */
    wdt_reset();
    client.flush();
    client.stop();
}
The status can be request by any browser or application by simply calling http://IPADDRESS/arduino/e
The response is
F 1000s V 255
C1 5.7 C2 11.5
F is the measurement frequency, V is the voltage calibration value, C1 and C2 are the CT sensor calibration values.
This function will be used by the Android application to find the Arduino device on the local network.
SPMONITOR_Y_SETUP
This routine is called once after a reset of the Arduino board. It contains the initialization routines for the network communication and the sensors 1 – setting the port for the activity LED
/* set pin to output */
pinMode ( activityLED, OUTPUT );
2 – initializing the network communication and access to the Linux file system.
/* Initialize bridge connection */
Bridge.begin();
/* Listen for incoming connection only from localhost */
/* (no one from the external network could connect) */
server.listenOnLocalhost();
server.begin();

/* Initialize access to SDcard */
FileSystem.begin();
3 – initialization of the light and CT sensors
/* Initialize counters and accumulators */
collPower[0] = collPower[1] = 0.0;
collCount[0] = collCount[1] = collCount[2] = 0;

/* Configure the YHDC SCT013-000 current sensors */
/* Initialise the current sensor 1 */
emon[0].voltage( 2, vCal, pShift1 ); // AD2, Vcal = 255, phase shift = 1.3
emon[0].current ( 0, iCal1 ); // AD0, Ical = 5.7
/* Initialise the current sensor 2 */
emon[1].voltage( 2, vCal, pShift2 ); // AD2, Vcal = 255, phase shift = 6.1
emon[1].current ( 1, iCal2 ); // AD1, Ical = 11.5

/* Get initial reading to setup the low pass filter */
unsigned int i = 0;
while (i<50) {
    /* LED on */
    digitalWrite ( activityLED, HIGH );
    emon[0].calcVI ( 20, 2000 );
    emon[1].calcVI ( 20, 2000 );
    /* LED off */
    digitalWrite ( activityLED, LOW );
    i++;
}
4 – Initialization of the timer and the watchdog
/* Initiate call of getMeasures and saveData every 5 seconds / 60 seconds */
lastMeasure = lastSave = millis();

/* Activate the watchdog */
wdt_enable(WDTO_8S);
Regarding the watchdog, you can see
wdt_reset();
frequently in the source code. With using the watchdog I make sure that when the program gets stuck anywhere that latest after 8 seconds a reset of the Arduino board is initiated. This makes sure that the program can run unattended for a long time.
This ends the short description of the Arduino source code. To see all details, check out my repository on Github where you can find the full source code.
Step 6: SOLAR PANEL MONITORING – ANDROID APP (1)


The Android app contains 5 main parts.
- The main application showing continuously the measured values from the Arduino board
- The database and functions to access the database
- The app widget which show the last measurements on the device home screen
- The background service that syncs the Android once every day with the Arduino board
- The reboot service which starts update timers for the app widget and the synchronization service automatically after the Android device was switched on or rebootet.
I will not go into every small detail of the source code, instead I will show the important code snippets of each modul.
THE MAIN APPLICATION
THE SPLASH ACTIVITY
When the application is started the first activity that is called is the SplashActivity.
SplashActivity general program flow:
SplashActivity onCreate

Wifi enabled?
no => stop
yes => IP address saved?
    no => start search for Arduino board in the local network
    yes => Arduino board connected to this IP address?
        no => start search for Arduino board in the local network
        yes => start the main activity

Search for Arduino board successfull?
no => stop
yes => start the main activity
Optional the IP address can be entered manually. The search for the Arduino board is done in an AsyncTask =>
private class findArduino extends AsyncTask<String, String, String>
Check out SplashActivity.java for details.
THE MAIN ACTIVITY
First activity here is to synchronisation the local database of the Android device with the database on the Arduino board. Again this is done in an AsyncTask =>
public class syncDBtoDB extends AsyncTask<String, String, String>
The synchronization can take some time, that’s why it needs to run in the background. After the synchronisation is finished the UI will show today’s measurements and a timer is started to update the information every minute.
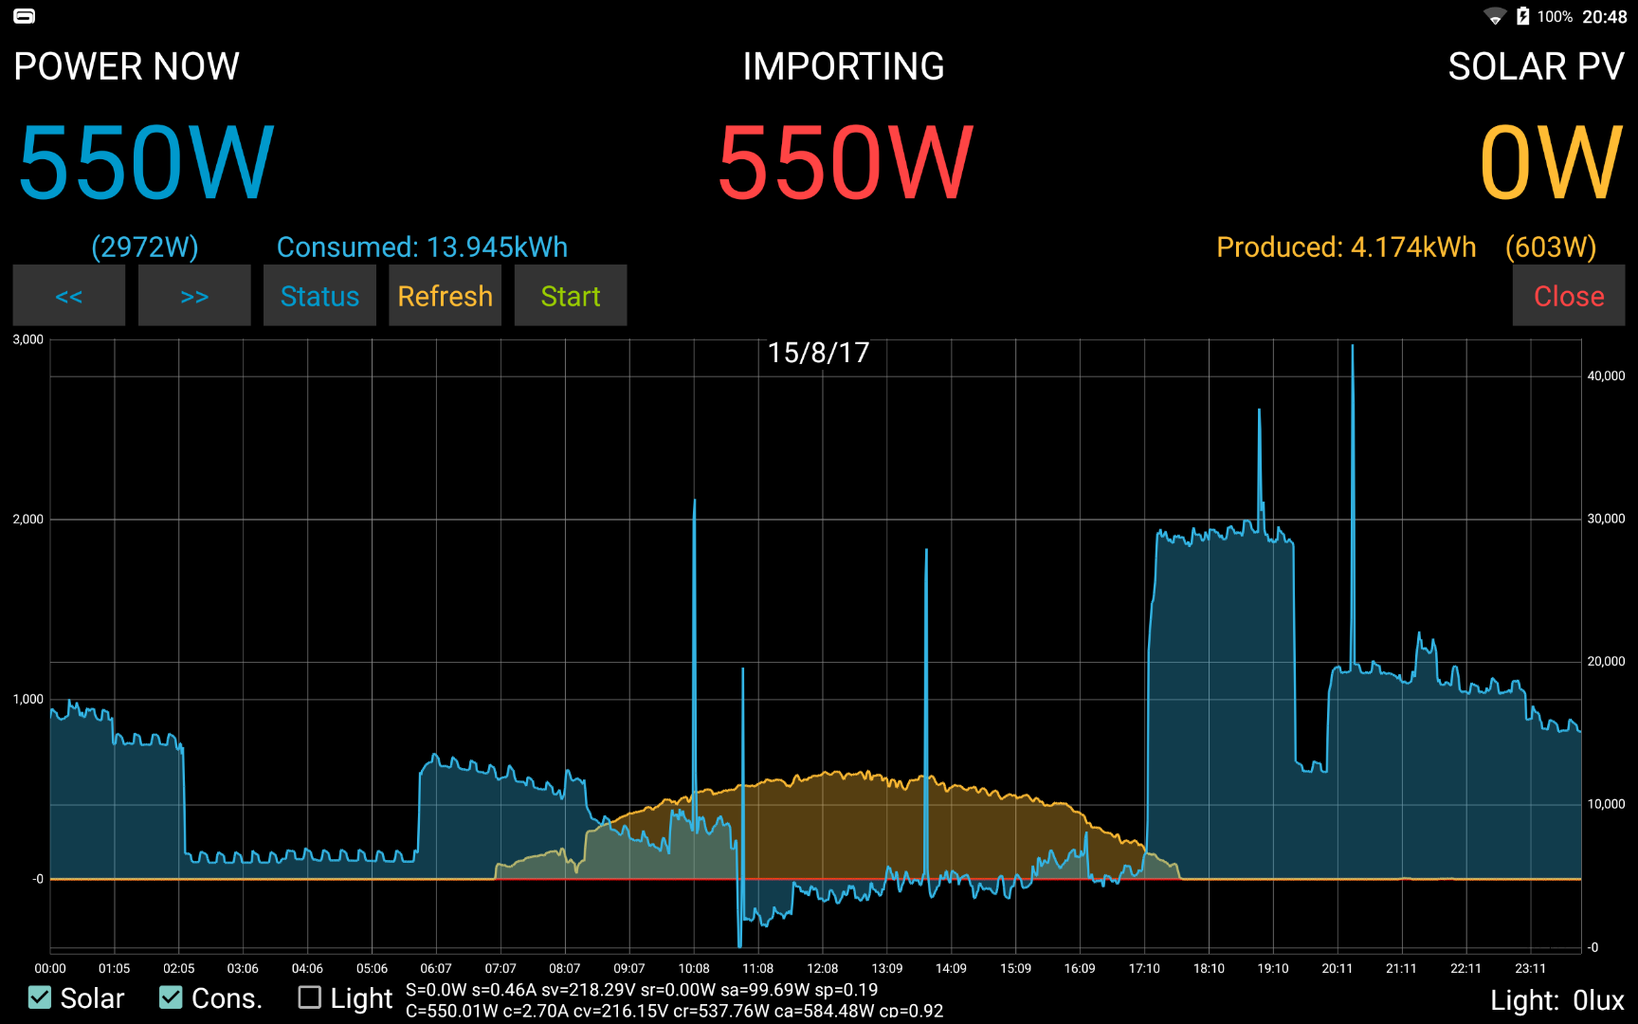
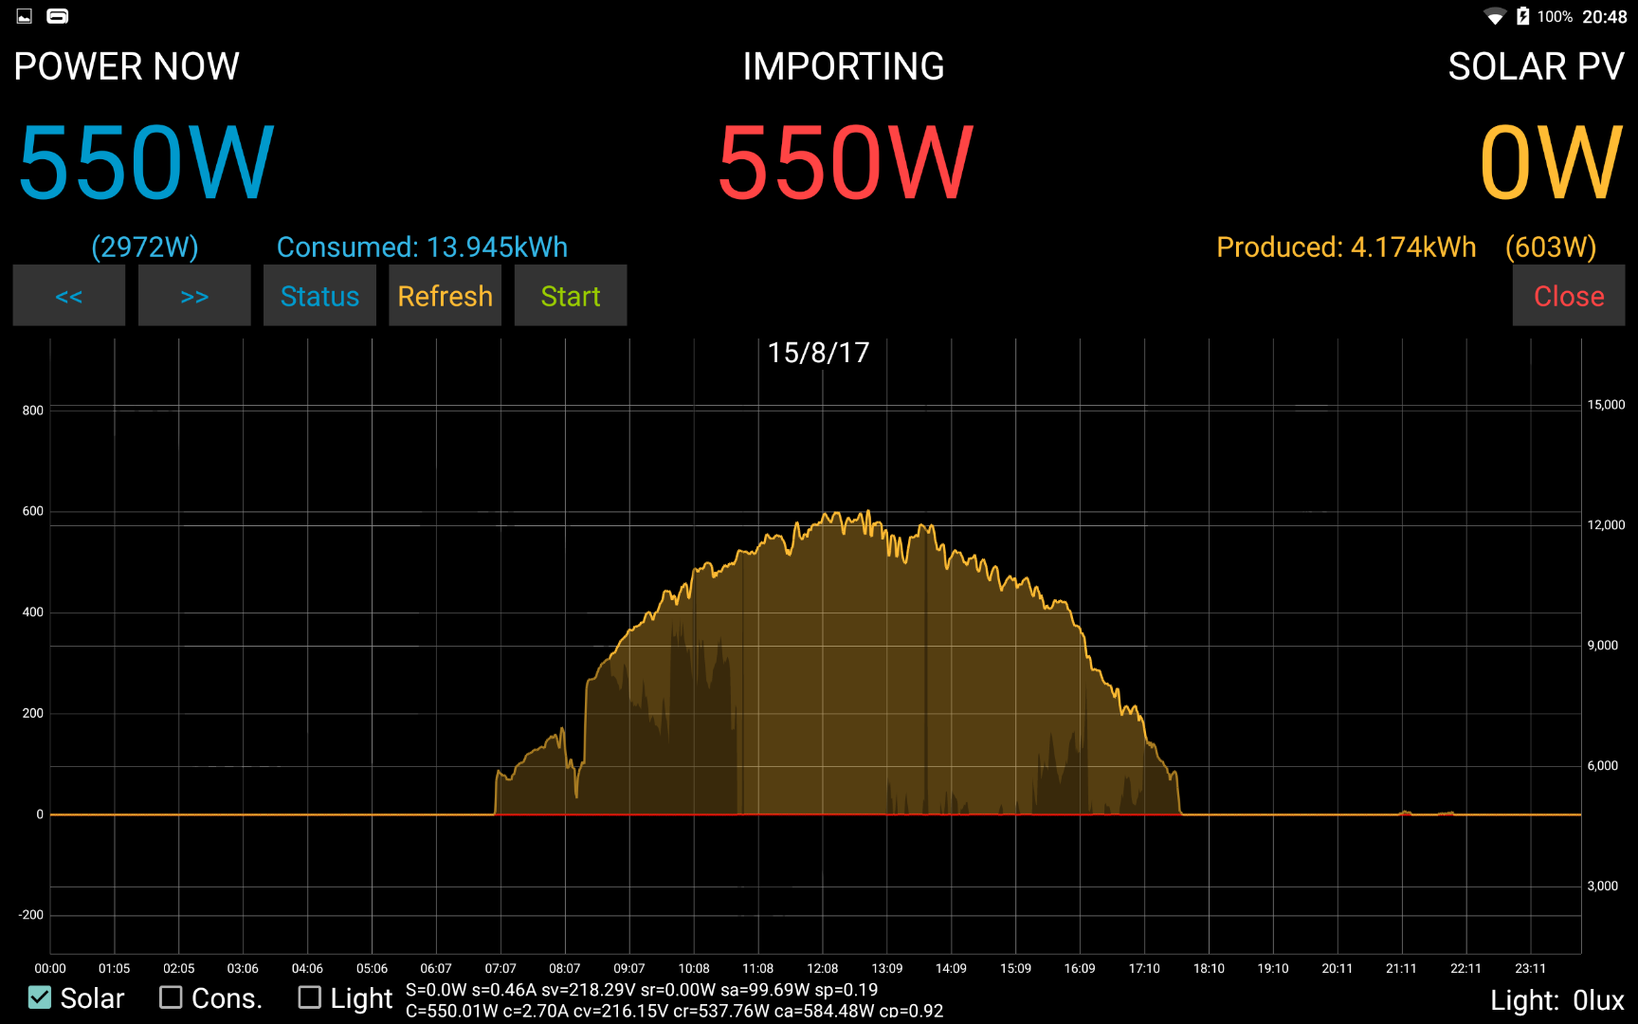
As you can see in the images above I used a screen from emoncms.org as a template for the main UI.
The screen shows in the top row the current power consumption (blue), the production of the solar panel (light orange) and in the middle if I export or import power to or from the power network. Below the maximum values are shown.
The chart view shows the overview from midnight to the current time. The blue line shows the power consumption. This line can show negative values if the solar panel produces more energy than the house consumes. The light orange line shows the power production of the solar panel.
The charts can be hidden with the checkboxes in the lower part of the screen. On the next screenshots only one of the charts is visible.
These chart is created with the open source graph library MPAndroidChart. It is a nice library and easy to use. You should check it out if you need some charts in your Android app. It offers a wide range of different chart types.
The chart can be zoomed horizontally and vertically. If zoomed it is as well possible to scroll through the chart. A tap on any part of the chart shows a small window with the values at this point.
The lower middle part of the screen is used for status messages. It shows after every update the values read from the Arduino board.
The buttons above the chart (from right to left):
Close => close the application
Stop (Start) => stop or start the continuous update of the chart
Refresh => sync the data of the device with the Arduino board
Status => show the calibration values used on the Arduino board in the status message window
<< and >> => show historical data
With the << and >> buttons the mode of the UI changes. With every press on one of these buttons historical data from the previous or next day is shown instead of the continuous refreshed data.
Pressing the start button goes back to the continuous mode. Two functions that are still missing is to backup the database to a file/cloud/PC and to restore data.
Step 7: SOLAR PANEL MONITORING – ANDROID APP (2)

THE APP WIDGET
App widgets are small windows that can be placed on the Android home screen. They can be used to show information or data of the application on the home screen without having the application running. I use this here to have the three main values (consumed power, exported or imported power and produced power) always visible when I use my phone or tablet.
The app widget uses its own timer
/** Intent for broadcast message to update widgets */
Intent startIntent = new Intent(SPwidget.SP_WIDGET_UPDATE);
/** Pending intent for broadcast message to update widgets */
PendingIntent pendingIntent = PendingIntent.getBroadcast(
		context, 2701, startIntent, PendingIntent.FLAG_CANCEL_CURRENT);
/** Alarm manager for scheduled widget updates */
AlarmManager alarmManager = (AlarmManager) context.getSystemService
		(Context.ALARM_SERVICE);
alarmManager.setInexactRepeating(AlarmManager.RTC_WAKEUP,
		System.currentTimeMillis(),
		alarmTime, pendingIntent);
to update the data every 1 minute. The refreshed data is pulled from the Arduino board
/** String list with parts of the URL */
String[] ipValues = deviceIP.split("/");
/** String with the URL to get the data */
String urlString="http://"+ipValues[2]+"/data/get"; // URL to call
/** Response from the spMonitor device or error message */
String resultToDisplay = "";
/** A HTTP client to access the spMonitor device */
OkHttpClient client = new OkHttpClient();
/** Solar power received from spMonitor device as minute average */
Float solarPowerMin = 0.0f;
/** Consumption received from spMonitor device as minute average */
Float consPowerMin = 0.0f;

/** Request to spMonitor device */
Request request = new Request.Builder()
		.url(urlString)
		.build();

if (request != null) {
	/** Response from spMonitor device */
	Response response = client.newCall(request).execute();
	if (response != null) {
		resultToDisplay = response.body().string();
	}
}

// decode JSON
if (Utilities.isJSONValid(resultToDisplay)) {
	/** JSON object containing result from server */
	JSONObject jsonResult = new JSONObject(resultToDisplay);
	/** JSON object containing the values */
	JSONObject jsonValues = jsonResult.getJSONObject("value");
	solarPowerMin = Float.parseFloat(jsonValues.getString("S"));
	consPowerMin = Float.parseFloat(jsonValues.getString("C"));

	/** Double for the result of solar current and consumption used at 1min updates */
	double resultPowerMin = solarPowerMin + consPowerMin;
	views.setTextViewText(R.id.tv_widgetRow1Value,
		String.format("%.0f", resultPowerMin) + "W");
	views.setTextViewText(R.id.tv_widgetRow2Value,
		String.format("%.0f", Math.abs(consPowerMin)) + "W");
	views.setTextViewText(R.id.tv_widgetRow3Value,
		String.format("%.0f", solarPowerMin) + "W");

	if (consPowerMin > 0.0d) {
		views.setTextColor(R.id.tv_widgetRow2Value,
			context.getResources()
			.getColor(android.R.color.holo_red_light));
	} else {
		views.setTextColor(R.id.tv_widgetRow2Value,
			context.getResources()
			.getColor(android.R.color.holo_green_light));
	}
}
with help of the okhttp library which has easy to use functions to communicate over a network.
THE DATABASE FUNCTIONS
I use an extension of the SQLiteOpenHelper to get easy access to a local database on the Android.
class DataBaseHelper extends SQLiteOpenHelper
The database is automatically generated when the application is opening it the first time
@Override
public void onCreate(SQLiteDatabase db) {

	db.execSQL("CREATE TABLE " + TABLE_NAME + " (" +
		"year INTEGER, month INTEGER, day INTEGER, hour INTEGER, minute INTEGER, " +
		"solar DOUBLE, cons DOUBLE, light LONG, " +
		"id INTEGER PRIMARY KEY AUTOINCREMENT);");
}
All necessary functions to access the database are implemented in the database helper class.
class DataBaseHelper extends SQLiteOpenHelper
	/**
	 * Add an entry to the database
	 *
	 * @param db
	 *            pointer to database
	 * @param recordLine
	 *            String with a record
	 *            format: yy,mm,dd,hh:mm,light,solar,consumption
	 *            e.g.: "15,08,13,13:54,35000,613.456,-120.22"
	 */
	public static void addDay(SQLiteDatabase db, String recordLine)
	/**
	 * Read data of day "dayNumber" and returns the data as a cursor
	 *
	 * @param db
	 *            pointer to database
	 * @param dayNumber
	 *            the day we want to read (1-31)
	 * @param monthSelected
	 *            the month we want to read from
	 * @param yearSelected
	 *            the year we want to read from
	 * @return Cursor dayStamp
	 *            Cursor with all database entries matching with dayNumber
	 *            Entry per minute is
	 *            cursor[0] = year stamp
	 *            cursor[1] = month stamp
	 *            cursor[2] = day stamp
	 *            cursor[3] = hour stamp
	 *            cursor[4] = minute stamp
	 *            cursor[5] = sensor power
	 *            cursor[6] = consumed power
	 *            cursor[7] = light value
	 */
	public static Cursor getDay(SQLiteDatabase db, int dayNumber, int monthSelected, int yearSelected)
	/**
	 * Get specific row values from the database,
	 * e.g. all years stored in the database or
	 *      all months of a year stored in the database or
	 *      all days in a month of a year stored in the database
	 *
	 * @param db
	 *            pointer to database
	 * @param requestField
	 *            requested row from db
	 *            "year" returns all year values found
	 *            "month" returns all month values found in year requestLimiterYear
	 *            "day" returns all day values found in month requestLimiterMonth
	 *                                              and year requestLimiterYear
	 * @param requestLimiterMonth
	 *            limiter for request
	 *            unused if requestField is "year"
	 *            unused if requestField is "month"
	 *            month if requestField is "day"
	 * @param requestLimiterYear
	 *            limiter for request
	 *            unused if requestField is "year"
	 *            year if requestField is "month"
	 *            year if requestField is "day"
	 *
	 * @return ArrayList
	 *            array list with all entries found
	 */
	public static ArrayList getEntries(SQLiteDatabase db,
	                                   String requestField, int requestLimiterMonth, int requestLimiterYear)
	/**
	 * Read data of day "dayNumber" and returns the data as a cursor
	 *
	 * @param db
	 *            pointer to database
	 * @return Cursor dayStamp
	 *            Cursor with the data of the last row
	 *            Entry is
	 *            cursor[0] = year stamp
	 *            cursor[1] = month stamp
	 *            cursor[2] = day stamp
	 *            cursor[3] = hour stamp
	 *            cursor[4] = minute stamp
	 *            cursor[5] = sensor power
	 *            cursor[6] = consumed power
	 *            cursor[7] = light value
	 */
	public static Cursor getLastRow(SQLiteDatabase db)
THE SYNCHRONIZATION SERVICE
The Arduino adds every minute a data set into the database. If the Android application is starting, the amount of data that needs to be synced can be quite large and take a long time to synchronize. To shorten this I created a background service that is called once a day to synchronize the databases of the Arduino and the Android device. For the synchronization the script query.php on the Arduino is called.
/** A HTTP client to access the spMonitor device */
OkHttpClient client = new OkHttpClient();/** String list with parts of the URL */ String[] ipValues = deviceIP.split("/"); /** URL to be called */ String urlString = "http://"+ipValues[2]+"/sd/spMonitor/query.php"; // URL to call
// Check for last entry in the local database /** Instance of DataBaseHelper */ DataBaseHelper dbHelper = new DataBaseHelper(intentContext); /** Instance of data base */ SQLiteDatabase dataBase = dbHelper.getReadableDatabase(); /** Cursor with data from database */ Cursor dbCursor = DataBaseHelper.getLastRow(dataBase); if (dbCursor.getCount() != 0) { // local database not empty, need to sync only missing dbCursor.moveToFirst();
int lastMinute = dbCursor.getInt(4); int lastHour = dbCursor.getInt(3); int lastDay = dbCursor.getInt(2);
urlString += "?date=" + dbCursor.getString(0); // add year urlString += "-" + ("00" + dbCursor.getString(1)).substring(dbCursor.getString(1).length()); // add month urlString += "-" + ("00" + String.valueOf(lastDay)) .substring(String.valueOf(lastDay).length()); // add day urlString += "-" + ("00" + String.valueOf(lastHour)) .substring(String.valueOf(lastHour).length()); // add hour urlString += ":" + ("00" + String.valueOf(lastMinute)) .substring(String.valueOf(lastMinute).length()); // add minute urlString += "&get=all"; } // else {} local database is empty, need to sync all data dbCursor.close(); dataBase.close(); dbHelper.close(); // Make call only if valid url is given if (!urlString.startsWith("No")) { /** Request to spMonitor device */ Request request = new Request.Builder() .url(urlString) .build();
if (request != null) { /** Response from spMonitor device */ Response response = client.newCall(request).execute(); if (response != null) { resultData = response.body().string(); if (Utilities.isJSONValid(resultData)) { /** JSON array with the data received from spMonitor device */ JSONArray jsonFromDevice = new JSONArray(resultData); /** Instance of DataBaseHelper */ dbHelper = new DataBaseHelper(intentContext); /** Instance of data base */ dataBase = dbHelper.getWritableDatabase();
// Get received data into local database
// skip first data record from device, it is already in the databasefor (int i=1; i<jsonFromDevice.length();i++) {
// JSONObject with a single record
JSONObject jsonRecord = jsonFromDevice.getJSONObject(i);
String record = jsonRecord.getString("d"); record = record.replace("-",","); record += ","+jsonRecord.getString("l"); record += ","+jsonRecord.getString("s"); record += ","+jsonRecord.getString("c"); DataBaseHelper.addDay(dataBase, record); } dataBase.close(); dbHelper.close(); } } } }
Again the okhttp library is used to access the Arduino board.
THE REBOOT SERVICE
It is necessary to start the timers for the app widget updates and the daily synchronization again after the Android device is switched on or was rebootet. This is done in the AutoStart class, which is called by the Android OS every time the device starts or was rebootet.
@Override
public void onReceive(Context context, Intent intent) { if (intent.getAction().equals("android.intent.action.BOOT_COMPLETED")) { /** Access to shared preferences of app widget */ SharedPreferences wPrefs = context.getSharedPreferences("spMonitor",0); if (BuildConfig.DEBUG) Log.d("spMonitor Autostart","Widget number = "+wPrefs.getInt("wNums",0)); if (wPrefs.getInt("wNums",0) != 0) { if (BuildConfig.DEBUG) Log.d("spMonitor Autostart","activating widget timer"); /** Update interval in ms */ int alarmTime = 60000;/** Intent for broadcast message to update widgets */ Intent widgetIntent = new Intent(SPwidget.SP_WIDGET_UPDATE); /** Pending intent for broadcast message to update widgets */ PendingIntent pendingWidgetIntent = PendingIntent.getBroadcast( context, 2701, widgetIntent, PendingIntent.FLAG_CANCEL_CURRENT); /** Alarm manager for scheduled widget updates */ AlarmManager alarmManager = (AlarmManager) context.getSystemService (Context.ALARM_SERVICE); alarmManager.setInexactRepeating(AlarmManager.RTC_WAKEUP, System.currentTimeMillis() + 10000, alarmTime, pendingWidgetIntent);
// Start service to register ScreenReceiverService context.startService(new Intent(context, ScreenReceiverService.class)); }
/** Calendar instance to setup daily sync */ Calendar calendar = Calendar.getInstance(); calendar.set(Calendar.HOUR_OF_DAY, 5); // trigger at 1am calendar.set(Calendar.MINUTE, 0); calendar.set(Calendar.SECOND, 0); /** Pending intent for daily sync */ PendingIntent pi = PendingIntent.getService(context, 2702, new Intent(context, SyncService.class),PendingIntent.FLAG_UPDATE_CURRENT); /** Alarm manager for daily sync */ AlarmManager am = (AlarmManager) context.getSystemService(Context.ALARM_SERVICE); am.setRepeating(AlarmManager.RTC_WAKEUP, calendar.getTimeInMillis(), AlarmManager.INTERVAL_DAY, pi); } }
The AutoStart class checks if there are any app widgets active and starts the update timer if necessary. The timer for the daily synchronization is started every time.
That’s it for the Android application. I didn’t go into details here, because the source code is quite big. But if you are interested you can check out the whole source code from my Github repository.
Head over to the last post of this series. There you find a list of hardware components I used, development IDE’s used for the Arduino and Android software development and necessary libraries used in the applications.
Step 8: SOLAR PANEL MONITORING – PARTS, IDE’S, LIBRARIES


LIST OF ELECTRONIC PARTS USED IN THE PROJECT:
D1                     1   LED white
U2                     1   Arduino Y'un
C1,C2,C3               3   Capacitor Electrolytic 100uF
CON2,CON3,CON4         3   2pin wire terminals
CON1                   1   4pin wire terminals
R8                     1   Resistor,100k
R9                     1   Resistor,10k
R12                    1   Resistor,1k
R1,R4,R5               3   Resistor,330
R10,R11,R2,R3,R6,R7    6   Resistor,470k

6 pin headers to connect sensor shield to Arduino  3
Prototype PCB for sensor connection shield         1
220V to 9V voltage transformer                     1
YHDC SCT013-000 current sensor                     2
Adafruit TSL2561 light sensor (optional)                    1
I got most of the parts from a local electronic shop around the corner.
DEVELOPMENT ENVIRONMENT
Arduino IDE => download from arduino.cc
Android Studio => download from Android Developers
LIBRARIES AND OTHER STUFF
Libraries for Arduino software
Adafruit Sensor library

-- Link:  https://github.com/adafruit/Adafruit_Sensor

-- License: Apache License, Version 2.0

Adafruit TSL2561 library

-- Link:  https://github.com/adafruit/Adafruit_Sensor

-- License: BSD License

OpenEnergyMonitor CT sensor library

-- Link:  https://github.com/adafruit/Adafruit_Sensor

-- License: Licence GNU GPL V3
Libraries fro Android software
MPAndroidChart - open source graph plotting library for Android

-- Link:  https://github.com/PhilJay/MPAndroidChart/
-- License: Apache License, Version 2.0

OkHttp - an HTTP & SPDY client for Android and Java applications

-- Link:  https://github.com/PhilJay/MPAndroidChart/
-- License: Apache License, Version 2.0

Okio - a modern I/O API for Java  https://github.com/PhilJay/MPAndroidChart/

-- Link:  https://github.com/PhilJay/MPAndroidChart/
-- License: Apache License, Version 2.0
Complete Github repository with source code, electronic schematics, code documentation
That’s it about this project. If you have questions or if I left something unclear or undocumented, please leave me a message here.

Participated in the
Arduino All The Things! Contest