

Introduction: Build Your Own ECG!

This is not a medical device. This is for educational purposes only using simulated signals. If using this circuit for real ECG measurements, please ensure the circuit and the circuit-to-instrument connections are utilizing proper isolation techniques.
The heartbeat consists of rhythmic contractions regulated by the spontaneous presentation of electrical depolarizations in cardiac myocytes (the muscle cells of the heart). Such electrical activity can be captured by placing noninvasive recording electrodes along different positions of the body. Even with an introductory understanding of circuitry and bioelectricity, these signals can be captured with relative ease. In this Instructable we introduce a simplistic methodology that can be used to capture an electrocardiographic signal with practical and inexpensive equipment. Throughout, we will highlight essential considerations in the acquirement of such signals, and present techniques for programmatic signal analysis.
Step 1: An Overview of Features


The device you are building will function through the following features:
- Electrode recordings
- Instrumentation amplifier
- Notch filter
- Low-pass filter
- Analog-to-digital conversion
- Signal analysis using LabView
Some key components you will need:
- NI LabView
- NI data acquisition board (for inputs to LabView)
- DC Power supply (to power operational amplifiers)
- Skin electrode pads for electrode recordings
- OR a function generator that can create a simulated ECG signal
Let's get started!
Step 2: Design a Low-pass Filter

A normal ECG contains identifiable features in the waveform of the signal called the P wave, QRS complex, and T wave. All features of the ECG will appear in the frequency range below 250 Hz, and as such, it is important to capture only the features of interest when recording an ECG from electrodes. A low-pass filter with a cutoff frequency of 250 Hz will ensure that no high frequency noise is captured in the signal
Step 3: Design a Notch Filter

A notch filter at a frequency of 60 Hz is useful to remove the noise from any power supply associated with the ECG recording. Cutoff frequencies between 56.5 Hz and 64 Hz will allow signals with frequencies outside of that range to pass through. A quality factor of 8 was applied to the filter. A capacitance of 0.1 uF was chosen. The experimental resistors were selected as follows: R1=R3=1.5 kOhms, R2=502 kOhms. These values were used to construct the notch filter.
Step 4: Design an Instrumentation Amplifier

An instrumentation amplifier with a gain of 1000 V/V will amplify all filtered signals to allow for ease of measurement. The amplifier uses a series of operational amplifiers and is divided into two stages (left and right) with respective gain K1 and K2. The image above displays a schematic of circuitry that may achieve this result and Figure 6 details the calculations made.
Step 5: Connect It All Together!

The three stages of amplification and filtering are combined in Figure 7 below. The instrumentation amplifier amplifies the sinusoidal frequency input with a gain of 1000V/V. Next, the notch filter removes all signal frequency of 60 Hz with a quality factor of 8. Finally, the signal passes through a low pass filter that attenuates signals beyond a frequency of 250 Hz. The figure above displays the full system created experimentally.
Step 6: ...and Make Sure It Works.
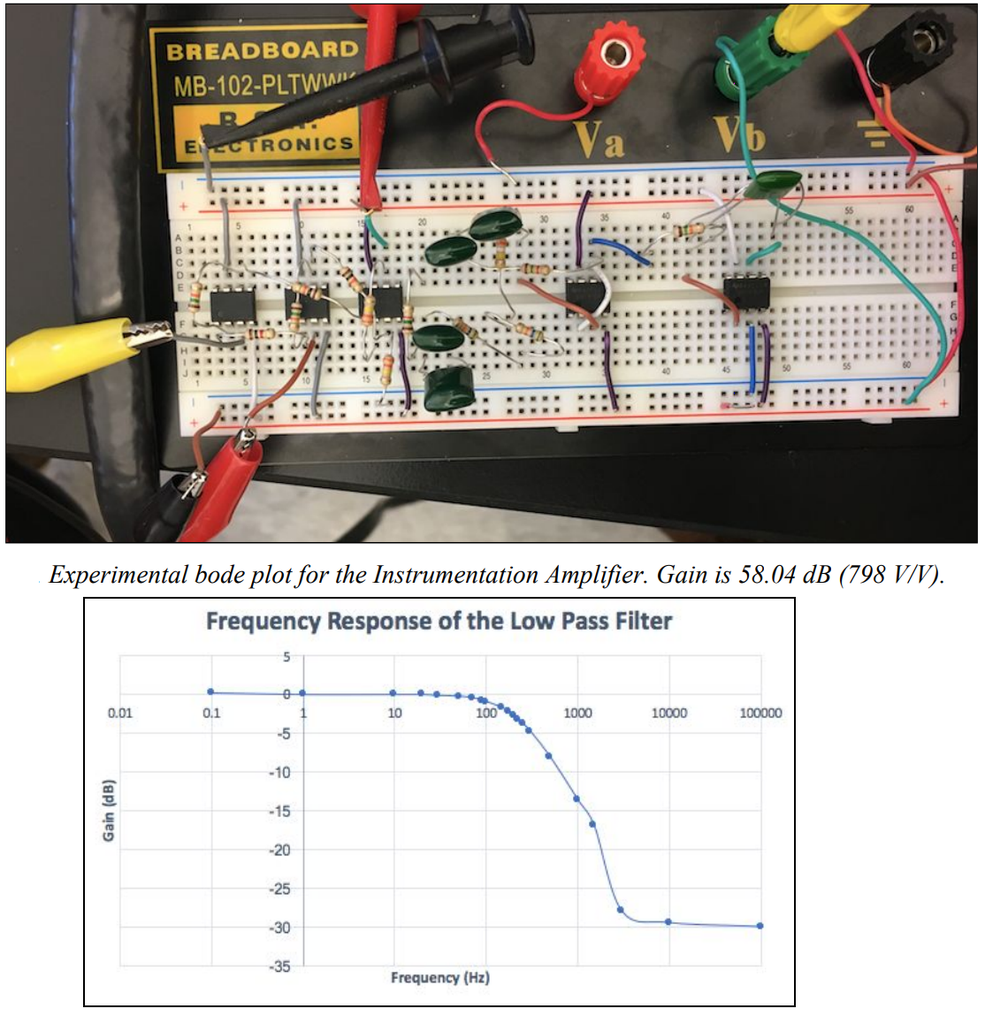
If you have a function generator, you should construct a frequency response curve to ensure a proper response. The image above shows the full system and the frequency response curve that you should expect. If your system appears to be working, then you are ready to move to the next step: converting the analog signal to digital!
Step 7: (Optional) Visualize Your ECG on the Oscilloscope

The ECG records a signal with two electrodes and uses a third electrode as ground. With your ECG recording electrodes, insert one into one input of the instrumentation amplifier, the other into the other instrumentation amp input, and connect the third to ground on your breadboard. Next, place one electrode on one wrist, the other on the other wrist, and ground on your ankle. This is a Lead 1 configuration for an ECG. To visualize the signal on your oscilloscope, use an oscilloscope probe to measure your third stage output.
Step 8: Acquire Data With National Instruments DAQ

If you want to analyze your signal in LabView, you will need some way to collect analog data from your ECG and transfer it to the computer. There are all sorts of ways to acquire data! National Instruments is a company that specializes in data acquisition devices and data analysis devices. They are a good place to look for tools to collect data. You can also buy your own inexpensive analog to digital converter chip, and use a Raspberry Pi to transmit your signal! This is probably the cheaper option. In this case, we already had a NI DAQ module an NI ADC and LabView in house, so we stuck with strictly National Instruments hardware and software.
Step 9: Import Data to LabVIEW

The visual programming language LabVIEW was utilized to analyze data collected from the analog amplification/filtering system. Data was collected from the NI DAQ unit with DAQ Assistant, a built-in data collection function in LabVIEW. Using LabView controls, the number of samples and time duration for sample collection were specified programmatically. Controls are manually adjustable, allowing the user to fine-tune input parameters with ease. With the total number of samples and time duration known, a time vector was created with each index value representing the corresponding time at each sample in the captured signal.
Step 10: Format, Analyze, and You're Done!
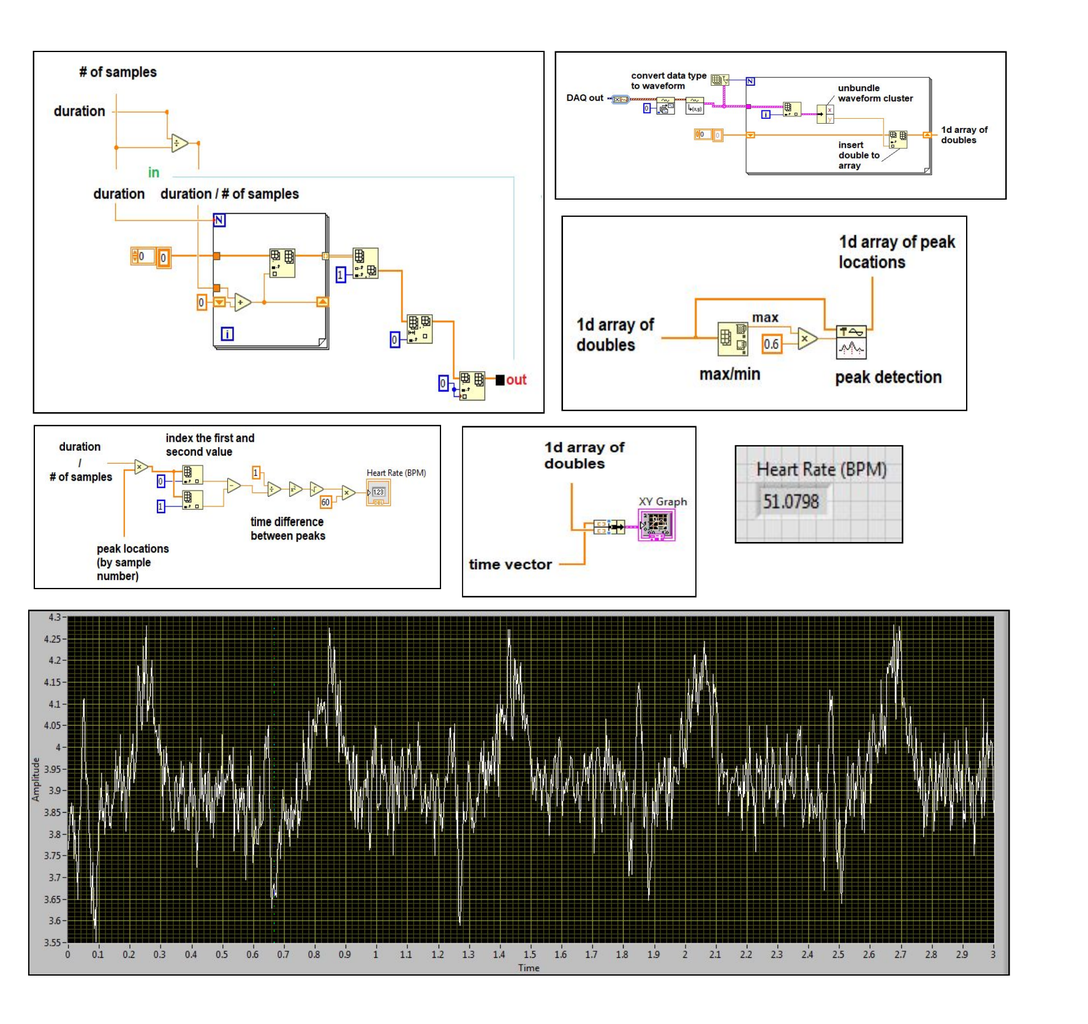
Data from the DAQ assistant function was converted into a usable format. The signal was recreated as a 1D array of doubles by first converting the DAQ output data type to a waveform data type and then converting to an (X,Y) clustered pair of doubles. Each Y value from the (X,Y) pair was selected and inserted into an initially blank 1D array of doubles with the help of a looping structure. The 1D array of doubles and corresponding time vector was plotted on an XY graph. Simultaneously, the maximum value of the 1D array of doubles was identified with a maximum value identification function. Six tenths of the maximum value was used as a threshold for a peak detection algorithm built-in to LabView. The peak values of the 1D array of doubles were identified with the peak detection function. With the peak locations known, the time difference between each peak was calculated. This time difference, in units of seconds per peak, was converted to peaks per minute. The resulting value was considered to represent the heart rate in beats per minute.
That's it! You have now collected and analyzed an ECG signal!


