Introduction: Internet-connected Home Energy Monitor


This is a magic box which will let you monitor the power consumption of your house from anywhere on the Internet! It measures both true power (Watts) and apparent (VA) power, it keeps a running total of electricity units used, and measures mains frequency as a bonus.
The project uses a Particle Core(*) module - a little board with an ARM microprocessor and a Wi-Fi interface - to do all the hard work. To build it, you'll need to be able to solder and follow a simple circuit diagram. At UK prices, total parts cost should be no more than £50.
The project was designed for 230V 50Hz (European) mains circuits, but with suitable calibration ought to work on US or other systems.
* - until a few days ago, Particle were known as Spark. You'll find 'Spark' sprinkled throughout the supporting files for this project - please be assured these are the same thing!
Step 1: Components List


You'll need the following major components:
The Particle Core (a.k.a. Spark Core) module
This comes in a nice little kit with a breadboard and USB lead. You can buy one direct from Particle at https://store.particle.io/, from Adafruit, or in the UK the cheapest I've found is from CPC.
There are two versions of the Core - one with a built-in 'chip' antenna, and one with a u.FL socket for an external antenna. I've found the built-in antenna is fine anywhere in my house where there is normal ("two or three blobs on an iPod") Wi-Fi reception. The external antenna would be better for poor signal areas (e.g. an outbuilding) but you'll have to add the cost of a separate Wi-Fi antenna and a u.FL 'pigtail' lead.
AC Current Sensor
This is a small magnetic device which clamps over a current-carrying mains conductor, and produce an output voltage which is proportional to the current flowing in the wire. The one I used was for an Owl home energy monitor, but you can search Amazon, eBay, etc, for 'AC Current Sensor' for a variety of alternatives. Make sure you choose one with enough maximum current capability for the load you're wanting to measure (e.g. 30A = 7kW approx). Please note - you don't want to use a 'current shunt': these are not isolated from the mains itself and cannot be used in this design.
AC output mains adaptor
The circuit needs an AC power input of between 6V and 12V (RMS). I found a 9VAC adapter for an old modem in my junk box; power consumption is low (3W or less), so pretty much any adapter will work. Note that a DC adapter won't work, because the monitor needs timing information from the mains to measure real power consumption accurately.
5V output DC-DC converter
My original plan was to use an old car USB charger to provide a step-down regulator to provide 5V to the Spark module. Sadly it proved faulty, so I designed a circuit based on the MC3063 IC. You can build this, or for simplicity you could use a ready-made module. A variety of modules based on TI's LM2596 chip are readily available from Amazon, eBay, or elsewhere.
Other components
The passive components used in the circuit are:
- C1 1000uF 25V electrolytic
- C2 100uF 10V electrolytic
- C3 100n ceramic
- C4 220u 25V electrolytic
- C5 470p ceramic
- D1-D4 1N4001
- Q1 2N2222A
- R1 10K
- R2,R7 1K
- R3 22K
- R4,R5 47K
- R6 220R
All resistors can be 0.25W, 5% tolerance or better. Metal film is preferable to carbon types, as they have lower noise.
You will also need:
- Connector for power input (and optionally the current sensor)
- An enclosure (I used an ABS box approx 14cm x 8cm x 4cm)
- Prototyping board (pad board or strip board)
- 2 x 12-pin 0.1" socket for Spark module
- Nuts, bolts and spacers for mounting
Step 2: The Particle Core Module

You'll need to be familiar with the basic operation of the Particle Core in order to connect it to a network and load firmware onto it.
The best place to start is Particle's own guide at http://docs.particle.io/start/. You don't need to have built anything at this point, as the Core can be powered via its USB connector.
Following the tutorial, make sure that:
- You have set up an account (user name and password) to access the Particle developer site.
- You have given the Core a name and connected it to a Wi-Fi network (using the Particle app on an iOS or Android device).
- You're familiar with the web IDE (build.particle.io), and are able to download simple programs (e.g the 'Blink an LED' example) onto the Core.
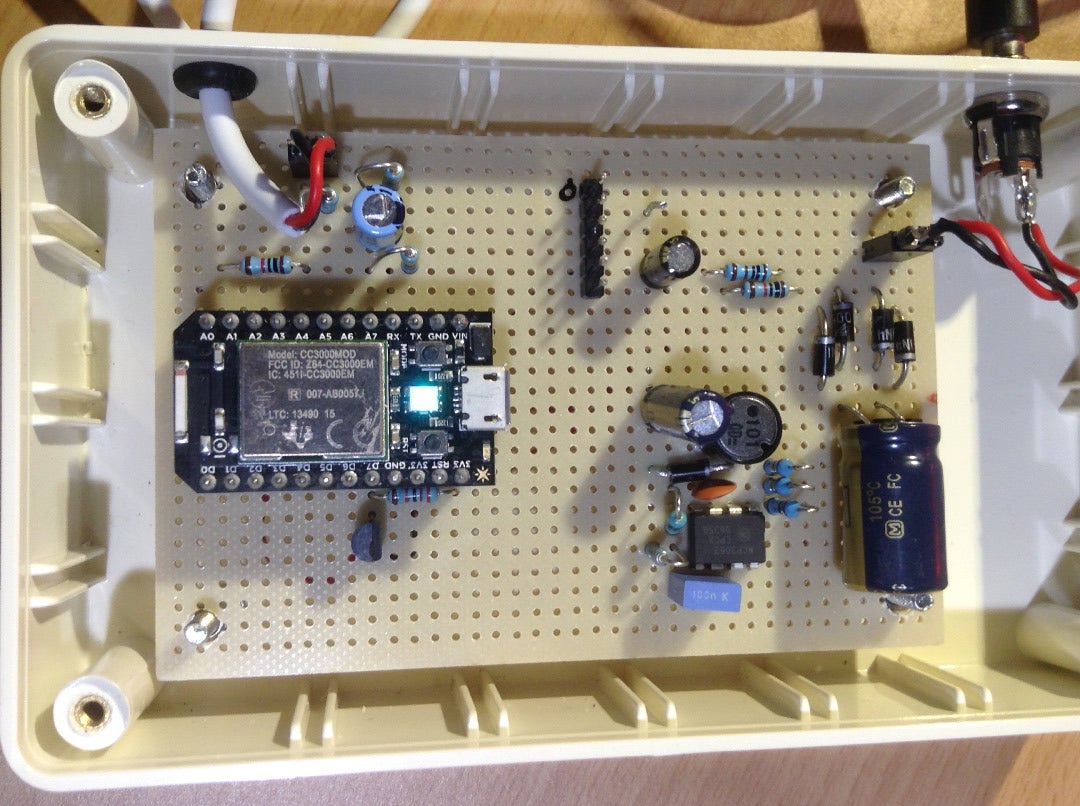
Step 3: Build Some Hardware!

Next, you'll need to assemble the circuit onto the prototyping board. The schematic is available as Spark-power-meter-main.pdf (see below) - you may find it useful to print it out and mark off components as you go.
The main circuit blocks are:
- D1-D4, C1-C3: AC rectifier and power supply
- R1-R3, Q1: 50Hz timing signal generation
- R4-R7, C4, C5: current sensor signal conditioning
Try to keep the last block relatively compact and close to the Core, as long wires will pick up unwanted noise and reduce the measurement accuracy. C5 should be wired as close to the Core pins as possible. The DC-DC converter should be kept separate.
Note:
If you are using a different current sensor, you may need to adjust the value of R6 later. It's a good idea to put this somewhere where it's not too difficult to unsolder it.
If you want to build the simple 5V DC regulator circuit, the schematic for this is given next.
Attachments

Step 4: (Optional) Discrete DC-DC Converter

The 5V regulator circuit I used is shown above; the schematic is in attachment NCP3063-converter.pdf . The required parts are as follows:
- C1 2.2nF ceramic
- C2 100nF ceramic
- C3 180uF or 220uF low-ESR type
- D1 1N5819
- IC1 NCP3063P
- L1 100uH, 1A current rating, high-frequency type
- R1-R3 1 ohm
Again, it pays to keep the layout compact as the switching regulator generates a certain amount of high-frequency noise. I soldered the 3063P IC straight into the board, to assist with heat dissipation.
Attachments
Step 5: Basic Checks

It's worth performing a few quick tests before putting the Core in its socket. Put a 100 ohm resistor (if you have a 0.5W or higher one, use it) in the socket between pins 1 and 2, then connect the AC input so that the circuit is powered. You should be able to measure 5V between pins 1 (TP2 in the schematic) and 2 (GND). If it's over 5.5V there may be a problem with the regulator (the Core is happy up to 6V).
If all is well, turn the power off, remove the resistor, and insert the Core into the socket. Apply power, and within a few seconds it should connect to Wi-Fi (LED flashing green), then connect to the Particle internet service (flashing cyan), then reach the 'running' state ("breathing" cyan). If no LED comes on within a second or two, turn everything off quickly and check the circuit!
Step 6: Load the Firmware

The firmware for the power monitor is in a single file power_monitor.ino. The simplest way to load this onto the device is:
- Ensure the monitor is turned on and connected to the Particle Cloud ('breathing' cyan)
- Open the Particle IDE at https://build.particle.io/ and log in
- Choose 'Create new app' and give it a title (power_monitor works for me)
- Now download power_monitor.ino from this page and save it to disk
- Open it in your favourite text editor, then cut and paste it into the Particle editor window
- Hit the verify button (the 'tick' shape) and check that it builds properly. (If there are errors, check that all the lines have been cut-and-pasted properly).
- If all is well, click 'Cores' in the IDE and make sure your core is selected (has a yellow star next to it), and click the 'Flash' button.
Attachments

Step 7: Give It a Test

When the firmware is loaded, you're ready to connect the sensor to something and give it a test.
The sensor is clipped round one (not both) of the live or neutral conductors carrying the current. I found it useful to build a test adapter which could be plugged between the mains supply and a load which allowed the sensor to measure the current in the live wire (see picture).
The measured values can be read via the Particle cloud API in a number of ways. To get started I've attached a simple program spark_power.py which can run on any computer which has Python installed and an Internet connection.
Download spark_power.py to a suitable folder on your computer, and then open a command line window (see instructions for Windows, Mac OS or Raspberry Pi) and navigate to the download folder using the cd command.
Now, at the command prompt, run:
python spark_power.py MyCoreName
replacing MyCoreName with the name you gave the Core in step 3. The first time you run this, it will ask you for the user name and password for your Spark account:
 Please enter Spark login email address: user@example.com
 Please enter password:
After a short pause, it will display the values it has fetched from the Spark core, something like this:
upTime              : 1508.0
connectTime         : 887.0
wifiRSSI            : -54.0
powerWatts          : 56.7
powerVA             : 57.8
mainsFreq           : 50.0
totalWh             : 2.3
sinPhi              : -0.1
You can re-run spark_power.py a second time, and it will skip the login name and password prompt - it saves a Spark access token in a file (~/.spark/spark.config.json) which can be used for later operations.
The variables you can read are:
upTime: This is the total time since the Core last rebooted, in seconds. You can use this to detect power interruptions (it will be reset to 0 following a power cut).
connectTime: The time in seconds that the Core has been connected to the Spark cloud service. If the connection is lost (e.g. due to a Wifi problem, or Internet outage), this will be reset to 0.
wifiRSSI: The 'Received Signal Strength Indication' value, expressed in dB. This is always negative, with more negative values meaning worse signal strength. In my testing, -40dB was a very good WiFi sign, down to about -85dB when the connection started to fail.
powerWatts: The real power being measured by the meter, in Watts. The reading is updated every second or so.
powerVA: The 'apparent' power currently being measured by the meter. The apparent power will be greater than the real power for 'reactive' loads (e.g. a computer power supply, or some types of motor) - see e.g. this paper for an explanation.
mainsFreq: The currently measured mains frequency, in Hertz.
totalWh: The total number of Watt-hours (of 'real' power) measured by the meter since it was booted. 1 Watt-hour is 1/1000th of a kWh, the standard "unit of electricity" read by your meter.
sinPhi: Shows whether the current load is resistive (=0.0), inductive (-1.0), capacitive (1.0), or somewhere in between. This is useful to know during meter calibration (see below).
Attachments
Step 8: Calibration

With the circuit as shown and the suggested current sensor, the firmware should not need much adjustment. However, there are a couple of values you can adjust for best accuracy with a variety of different components.
For calibration, I used an electric kettle connected via my test adapter. This is a simple (purely resistive) electrical load, it gives a nice strong signal on the sensor, and has a known (or easily measured) power consumption. Electrical heaters or incandescent lamps are also good for calibration.
Timing calibration
For accurate measurement of 'real' vs 'apparent' power, the meter needs to get timing information from the AC mains (via the circuitry around Q1). You can adjust this using the cal_PhaseTrim value in the firmware.
When using the kettle, or other resistive load, the sinPhi value read from the meter should be as close to 0 as possible, and powerWatts should be equal to powerVA. If this is not the case, reducing the cal_PhaseTrim value will make sinPhi more negative, and increasing it will make it more positive. Change the value in the firmware by a small number and re-flash the Core. After a few tries you should find an optimum setting.
Setting absolute accuracy
The cal_Scale value is used to calibrate all the power reading values (powerWatts, powerVA and totalWh) read by the meter. You can adjust it so that the measured power matches a power reading you know to be accurate (e.g. measured with a plug-in mains power meter). The power readings are directly proportional to the cal_Scale value, so if it is over-reading by, say, 15%, dividing cal_Scale by 1.15 will put it right.
Changing full-scale sensitivity
The meter will read up to approximately 10kW full scale using the component values shown. It is possible to change the maximum reading (or adjust for different sensors) by increasing or reducing the value of R6, and re-calibrating cal_Scale afterwards. Lower values of R6 will increase the maximum reading, at the expense of lower accuracy at lower readings. To maximise sensitivity (at the expense of a lower maximum reading), R6 can be increased, up to a maximum of about 1k.
Step 9: Go Collect Some Data!


Once calibration is complete, the complete kit can be installed. The photo shows the current sensor attached to one of the mains supply cables in my house.
The spark_power.py program can be used to take periodic readings, and produce output suitable for importing into a spreadsheet program. To do this, use the -c option to produce "CSV" (comma-separated-value) output, and the -t option to specify a number of seconds to wait between readings. For instance, you can run:
python spark_power.py -c -t 20 MyCoreName powerWatts powerVA mainsFreq
This will produce output similar to this:
17/05/15,20:34:42,942.7,962.4,50.0
17/05/15,20:35:06,943.8,974.9,50.0
17/05/15,20:35:29,916.7,971.5,50.0
17/05/15,20:36:03,999.0,1019.1,50.0
...
The first two fields are the date and time, and the next are the powerWatts, powerVA, and mainsFreq values as requested.
After that, it's up to you!
Useful links
- All the code and schematics for this project are available at https://github.com/IanHarvey/spark-monitor
- If Python isn't your first choice language, there's a Javascript API for Particle devices at https://github.com/spark/sparkjs
- Ask questions and get tips on the Particle forum at https://community.particle.io/