

Introduction: Measuring Reflectance Using Ocean View


In this instructable I´ll show how to set the dataflow to obtain the reflectance using an spectrometer for different applications.
The final steps will show you how to obtain the reflectance in an specific wavelength range .
Step 1: Material List


- Spectrometer (Ocean Optics USB 4000)
- OceanView 1.5 App (http://oceanoptics.com/product/oceanview/)
- Source Light
- Teflon Tape
- Reflection Probes
Links:
http://oceanoptics.com/product/usb4000-uv-vis/ (Ocean Optics USB 4000)
Step 2: Installing the Software
OceanView spectroscopy software provides full control of all Ocean Optics spectrometers.
You can download and use a trial version for 10 days.
http://oceanoptics.com/support/software-downloads/oceanview-10-day-free-trial-form/
Step 3: Setup Your Equipment

First, you have connected the spectrometer. one fiber plug in the spectrometer and the other plug in the source light.
Step 4: Configuring in Reflectance Mode


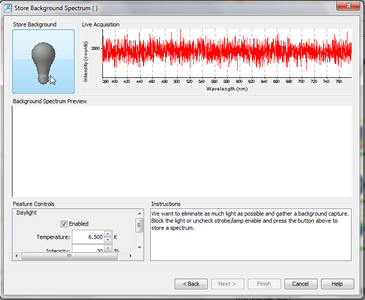
In OceanView you need to select the reflectance mode in the Spectroscopy Wizard. Then you have to setup the reference levels for reflectance. The maximum level of reflectance occurs when the incident light is equal to the reflected light and the minimum level of reflectance occurs when there is no light at all.
To setup the maximum reflectance, I used Teflon tape, and for the minimum level or background I used a mate black cardboard with the light source turned off.
Now, you have setup the dataflow for measuring the reflectance in an specific wavelength range.
Step 5: Dataflow to Obtain Reflectance. (part 1)


In order to obtain the specific data you have to set the dataflow and determinate the wavelength range.
The first image shows the complete dataflow for measuring reflectance in NIR and Visible ranges ,and also the NDVI.
The important blocks that we used are:
-Sub_Rng:
Limits the x-axis bounds of an array and outputs the truncated array.
Location: Advanced Math -->Array Math --> Subrange
-Avg:
Outputs an average of an array.
Location: Basic Math -->Average
-Aggregate:
Aggregates individual scalar values to display in a Table View.
Location: Advanced Math -->Filtering -->Aggregate
-Add Scalar View:
Adds a scalar view to the View Window.
Location: Views -->Add Scalar View
Step 6: Dataflow to Obtain Reflectance. (part 2) - Average Calculation


To setup the average calculation, you need to configure the Sub_Rng block and wire it to the Avg block.
The Sub_Rng limits the data between the START and END range. The Avg block calculates the data average.
In this example I'm using two ranges: (500-530 nm.) and (400-450 nm.).
Then, to show the average I use the Scalar View block and for saving into a table I use the block Aggregate wired to Table block.
That's all !!!
Have fun and don't forget to post your results in comments.
For more information please visit:
Thanks for reading.


