Introduction: Quadcopter Data Visualization With Plotly


Modern quadcopters can be used for various purposes other than entertainment and model aircrafts, such as applications for surveillance or assistance in some inaccessible places for humans as well as the monitoring of adverse situations. Therefore, these devices are equipped with a number of sensors to collect determined information. Many of these applications require the display of real time information, so a wireless communication system between the quadcopter and the final user is necessary. The final user may not be the driver of the device, he can be located in a base station or in a laboratory far from the flying area, so internet is the best and easiest way to communicate two distant points. We need to get the data of the quadcopter and transfer it to the final user easily and quickly.
Plotly offers this service for free, it provides tools for information management and also the ability to export or import data.
The purpose of this tutorial is to explain how to establish communication between these devices in order to collect and display information.
Step 1: Materials


This project is part of a larger project involving the creation of a quadcopter. In this part of the project we want to collect the information of the sensor system that will be sent to the final user. The main controller of the quadcopter is based on an Arduino single-board microcontroller and the best way to send data via Internet is a WiFi shield. In this example, due to the lack of a WiFi shield, we opted for an Ethernet shield, although the code with both shields is not much different and can be easily adapted to a WiFi shield.
The materials used in this example are:
- Arduino UNO (you can use any Arduino)
- WIFI shield, or in our case an Ethernet shield, to connect with the Plotly web service. Additionally, these boards often incorporate a system to use a SD storage card, which allows us
- Shield WIFI, or, in our case Ethernet shield, to connect with the Plotly web service; in addition, these boards often incorporate a system to use SD card storage, which allows us to store sensor data when we have no access to a WiFi or Ethernet network.
Sensors. Any sensor we want to obtain information either with direct connection to the arduino or with an intermediate conditioning. In our case we use the GY-80 IMU, affordable and with good results.
In the case you use an Ethernet shield you will need an Ethernet wire.
At least, you need power the Arduino, with batteries or USB wire.
Step 2: Electronics

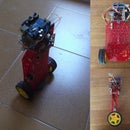
The first step is to build our device. This operation is relatively easy, because the shield is directly connected to the Arduino and you do not have to wire it. On the other hand we have the IMU sensor, that only requires four wires to be connected to the Arduino.
The four wires are: two for power (3.3V and GND), and two for the I2C communication (SDA and SCL). The power pins go to the corresponding pins on the Arduino (or WiFi/Ethernet shield), and the SDA and SCL pins to the pins in the Arduino, as depicted in the image.
You have to connect the Ethernet wire to an access point, like a router, modem, etc.
Note: some Ethernet shields don't have SDA and SCL pins, so you have to connect this pins to the Arduino first and then connect the shield. You also can connect the SDA and SCL pins to the analog pins A4 (SDA) and A5 (SCL)
Step 3: Plotly


Plotly is very easy to use and in its page there are several tutorials which teach you everything you need from the ground up to use its features .
The first thing to do is create an account on the website, which is completely free. Once the account is created we have instant access to a number of functions. For this example we need access to Plotly data stream , so we need to take some values of our account, all of this can be done at the following address. Once we have access to the data, we proceed:
In the Profile tab:
- User name
- API key
In Stream of tokens tab:
- We have to take as tokens as data variables we need to stream.
The stream tokens are the data streams from each of the variables we want to display. In our case, we have four different data streams so we need four tokens. Initially we have none. To create one, just click on ‘generate token’. We create four and we take their keys. These details will be needed later when we make our code for the data collection program.
Plotly API:
Plotly offers a number of libraries for different environment (Python, R, MATLAB, perl, Arduino, ...), facilitating the task of the developer using Plotly service. We use the Arduino library where you can find help, tutorials, and examples on how to communicate Arduino and send data to Plotly in an easy way.
For streaming the data we need to download the Plotly's Ethernet library (Plotly's WiFi library if you use the WiFi shield), once the folder is downloaded, you have to cut-paste it in the Arduino's library path, normally located in C:\Program Files\Arduino\libraries.
Once this part is done, the only thing left is the code, where we must obtain the information of the sensors and send it to Plotly with its library.
Step 4: Code

The code is not completely explained, only the most important parts. Still, you can download the code and I think that is fairly well understood. if you have any questions do not hesitate to ask.
The code consists of 3 files, the main one with the main code, initialization sensors, debug, main loop, etc. Another file to control the accelerometer and gyroscope, and a third one for the barometer and temperature sensors. First we define the constants and variables that the program will be using. For Plotly we define three variables:
#define num_traces 4
Is the number of data variables we want to visualize, in our case 4.
char *streaming_tokens[num_traces] = {"your_plotly_stream_token", "another_plotly_stream_token",… };
Here we specify the keys of our stream tokens, each one for each data variable.
plotly graph = plotly("your_plotly_username", "your_plotly_api_key", streaming_tokens, "your_plotly_filename", num_traces);
Finally a data type in order to allow the arduino to connect with our Plotly service, we have to indicate the name of our Plotly account, the API key, and the name of the file which will store the data.
The main code initializes the sensors and configures the Ethernet shield to establish contact with the Plotly web service.
In the loop we execute the function every 100 milliseconds. That means that our sample frequency is 10 Hz (we can use other frequency like 100 or 1000 Hz). That function takes the values of the sensor, process them (Kalman filter, complementary filter,...), and finally sends the data to the Plotly service.
I made two programs, one for use the data of the accelerometer and gyroscope, sending four angles to Plotly, and a second one that measure the temperature and the pressure and sends these values plus the altitude value previously calculated to Plotly.

Step 5: Sensors. Extra


As a bonus I'll explain the sensor that I used and how I used it to obtain a good result. On the one hand, the sensor fusion between the gyroscope and accelerometer is very useful to control the quadcopter horizontality, and on the other, the altitude of the quadcopter is also a good data to obtain, and is measured using the pressure sensor and the temperature sensor.
Sensor fusion
In order to maintain the horizontality of the device, we use two angles, pitch and roll. These two angles are measured using two sensors: accelerometer and gyroscope. Both have their advantages and disadvantages. The accelerometer can measure the force of the gravity, and with that information we can obtain the angle of the device. The problem of the accelerometer is that it can also measure the rest of the forces the device is subjected to, so it makes a lot of errors and noise. The gyroscope measures the angular velocity, so if we integrate this data we can obtain how much the angle is moved. The problem of this measure is that is not perfect and the integration has a deviation. That means that in a short span of time the measure is very good, but for longer spans the measure angle will deviate much from the real angle.
Combining both sensors can solve these problems. That’s called sensor fusion, and there are a lot of methods to combine them. In this project I have tried two of them: the Kalman Filter, and the complementary filter.
- The Kalman filter is an algorithm very extended in robotics, and offers a good result with low computational cost. There is an Arduino's library that implements this method, but if you want to learn more about that method or implement it by yourself look at this page.
- The Complementary filter is a combination of two or more filters that connect the information from different sources and gets an estimation of the real value. It can be implement in only one line of code. For more information visit this page.
angle = A * (angle + gyro * dt) + (1 - A) * accel;
where A is normally equals to 0.98.
First I tried to use a Kalman filter but I did not obtain good results. The angle was calculated with a little delay and it affected the control. The Kalman filter has three variables that you can change based on the parameters of your sensors, and by doing this you can obtain better results. I tried to change the values, but I did not get better results so I decided to implement the complementary filter. It happened to be much easier and had a lesser computational cost. The complementary filter worked fine for me.
Sea level height
In order to control the position of our quadcopter we need to know the altitude. This can be measured by the combination of a pressure sensor and a temperature sensor. It can be obtained only from the pressure data, using the following equation:
H = 44330 ( 1 - ( Pressure_measured / 101325 ) ^ ( 1 / 5.25588 ) )
i obtained the equation form the datasheet of the sensor I used (BMP085) This equation is based on the Barometric Formula using the data of the standard atmosphere That means that is not true in every case, but for non-precise applications is enough. For more precise applications we need to use temperature and pressure, using the next formula:
H = ( ( ( 101325 / P ) ^ ( 1 / 5.257 ) - 1) * ( T + 273.15 ) ) / 0.0065
I'm not sure if this formula is correct, but it seems to work. There is a page where you can calculate the altitude providing the pressure at sea level and the pressure and temperature at the point you want to calculate the altitude.
Note: In this two formulas the altitude is calculated relative to the sea level, so if you want to get the altitude relative to the ground you have to measure first the altitude at ground level and subtract it from the subsequent measures.
Step 6: Tests


I did some tests before the valid one. I tested the sensors, the communications and the Ploty service. In my first try with Ploty I used its tutorial, which you can find well explained in the next link. They use a WiFi shield, but it is easy to change the code to use it on the Ethernet shield, and also, the library provides examples on how to use with an Ethernet shield. It is very easy. Just follow the following steps:
- Plug the Ethernet shield to the arduino,
- Connect the Ethernet cable.
- Program the arduino.
- Power the arduino.
- Open a serial terminal
- Wait some time while it connects to the Plotly web service, and after a few seconds it will write in the serial terminal the web page address where you can see the results (look at the images to see an example)
- Open a browser, write the direction of the serial terminal
- Enjoy your data!
You could see two graphics with the noise data that produce the analog pins with nothing connected. It proofs that the system works.
You could see two graphics with the noise data that are produced by the analog pins with nothing connected. It proves that the system works. The next step is to use the program that shows the data that you really want to obtain. In my case I use Plotly for two measures: firstly to obtain the roll angle of my IMU sensor and show the results. The graphic showed the angle given by the accelerometer, the angle given by the gyroscope, and two angles of the sensor fusion, the one obtained using Kalman, and the one obtained using the complementary filter.
In my second experiment I used the Barometric sensor, which showed in Plotly the pressure, the temperature, and the altitude relative to the sea level of the device.
Step 7: Future Developments

Of course, the purpose of this project is to implement these data collecting sensors and communication devices in a real quadcopter, offering the option to send data via internet to a desired location. The final shield we'll use is a WiFi shield, and the idea is to use a cell phone as a WLAN hotspot where the Arduino is connected. Using the 3G of the cell phone allows us to be connected to internet everywhere, for example on top of a mountain where we want to explore an inaccessible peak for humans.
Using the cell phone as a hotspot gives us the possibility of controlling the quadcopter with the cell phone through a determined application.
Another possible idea is not to connect the Arduino to internet but send data to a base station near the flying area, and then resend it via internet to other places. This simplifies the system and saves battery (The WiFi shield consumes so much power).

Participated in the
Arduino Contest
Participated in the
Sensors Contest

Participated in the
Data Visualization Contest