

Introduction: Simple 3 Phase Arduino Energy Meter


Since writing up instructions on how to build a simple Arduino home energy meter which measured the energy consumption for a single phase, I’ve had a number of people ask about modifying it to be a 3 phase energy meter. While there is a range of commercially available single phase energy meters available, the 3 phase meters aren’t nearly as common and tend to be quite expensive. So I decided to take the time to build a 3 phase energy meter and fix up a couple of areas in the original energy meter’s code which could have been done better.
Again, with this meter I was going for simplicity. Sure, for perfectly accurate measurements you need to measure both the supply current and voltage but for this application and in the interests of keeping the energy meter simple and safe – only requiring a non-contact connection to your mains – I’ve decide to stick with a simple current measurement which gives you an estimate to within a couple of decimal points of a kilowatt hour.
This meter measures the supply current through each phase using a CT (current transformer) and then does a few calculations to give you the current, power, maximum power and kilowatt hours consumed for each phase. With a few changes to the code, you can also add your local tariffs and display the cost of electricity used to date.
This instructable assumes you know the basics of Arduino programming, otherwise read my guide on getting started with Arduino. You also need to know how to connect an LCD screen to an Arduino although you can use an LCD screen shield which does most of the work for you.
Step 1: What You Will Need to Build the Energy Meter
- An Arduino (Uno used here)
- LCD Shield (Or LCD Screen, follow how to connect an LCD screen)
- 3 x CTs – Talema AC1030 (See step for different options)
- 3 x 56Ω Burden Resistors
- 3 x 10µF Capacitors
- 6 x 100K Divider Resistors
Step 2: Assembling the Circuit


First you need to start by assembling your components onto the CTs to create the current sensors which produce a signal which your Arduino can understand. An Arduino only has analogue voltage inputs which measure 0-5VDC, so you need to convert the current output from the CT into a voltage reference and then scale it into the 0-5V input range.
If you are going to be installing your power meter somewhere permanently then you may want to solder the resistors and capacitor directly onto each CT so that they cannot come loose. If you are simply trying this project for fun then a breadboard is perfect.
The basic circuit for the connection of the CTs to the Arduino is shown in the attached circuit diagram.
The LCD screen shield already picks up on the analogue inputs but only A0 is used by the shield for the button inputs. Simply solder the five leads from your current sensors onto the pin headers on the shield and use A1 to A3 as your sensor inputs as shown in the attached image.
Once you have connected all of your components, you need to connect your sensors onto the supply you want to monitor. For connection to a typical 3 phase mains supply, connect one CT around each of the phases as shown in the attached connection diagram.
Each CT should only have one wire/phase running through its core.
NB – Be careful when connecting the CTs to your mains and make sure that the power to your board is switched off before doing anything in the mains box. Do not remove any wires or remove any screws before checking your local regulations with your local authority, you may require a certified electrician to install the CT for you.
Step 3: Choosing Different Components
There are essentially four components which need to be chosen or correctly sized for your energy meter.
Choosing A Current Transformer
The first is the CT or current transformer. The one used here is the Talema AC1030 which can sense 30A nominal and 75A maximum current. At 220VAC, it can theoretically sense up to 16.5kW for short periods of time but it is sized to continuously sense 6.6kW which is suitable for a small household. To calculate how many amps yours needs to sense, take the maximum continuous power your are expecting to sense and divide that by your voltage (usually 110V or 220V depending on your country).
Sizing The Burden Resistor
Next you need to size your burden resistor R3, this converts your CT current into a voltage reference. Start by dividing your primary current (the maximum as used above) by your CT’s turns ratio (available on the data sheet). This should be around 500-5000 to 1. This article worked on 42A with a turns ratio of 1000:1 giving a secondary current of 0.042A or 42mA. Your analogue reference voltage to the Arduino is 2.5V so to determine the resistance you use R=V/I – R=2.5/0.042=59.5Ω. The closest standard resistor value is 56Ω, so this was used.
For a list of some options on different CTs and their ideal burden resistors, visit this link.
Sizing The Capacitor & Dividing Resistors
The capacitor used is 10µF which should be sufficient for most CT ranges for household applications. Finally you need two dividing resistors to get the 2.5V reference voltage from the Arduino. They must be the same value, so R1=R2 and we don’t need much current so this articles uses two 100K resistors.
Step 4: Upload the Sketch
Now you can upload your sketch onto your Arduino, if you haven’t uploaded a sketch before then follow this guide on getting started.
Here is the link to download the 3 phase meter code.
Because your setup, CTs , resistors and input voltages may be different, there is a scaling factor in the sketch which you will need to change before you will get accurate results, see below for calibration. If your LCD is connected to the same pins as used here and your CTs are connected to the same input pins, you should at least get the screens populated with some figures although these will most likely be incorrect and some may be negative.
This code, unlike our original simple Arduino energy meter’s code makes use of the millis() function to calculate the duration between cycles instead of relying on an estimate, this results in a slightly more accurate (about 0.5%) calculation. For those of you who have read that the millis() function goes into overflow after about 49 days, the code deals with the rollover automatically by making use of the unsigned long variable. For example, if the overflow happens at 10000, the start millis was 9987 and the end millis was 2031, the difference would be 2031-9987=-7956 but the value can’t be negative as it is unsigned so it becomes -7956+10000=2044 which is the correct duration.
Step 5: Calibrate the Current Reading
As mentioned above, because your setup, CTs , resistors and input voltages may be different, there is a scaling factor in the sketch for each CT which you will need to change before you will get accurate results.
To calibrate your energy meter, your need to be sure that the current that your meter says is being drawn on each phase is what you expect is actually being drawn. In order to do this accurately, you need to find a calibrated load. These are not easy to come by in a normal household so you will need to find something which uses an established and consistent amount of power. I used a couple of incandescent light bulbs and spot lights, these come in a range of sizes and their consumption is fairly close to what is stated on the label, ie a 100W light bulb uses very close to 100W of real power as it is almost entirely a purely resistive load.
Plug in a small light bulb (100W or so) on each phase and see what load is displayed. You will now need to adjust the scaling factors defined in line 8 accordingly:
double calib[3] = {11.8337,11.8234,12.0325}
In this case they were 11.8337 for phase 1, 11.8234 for phase 2 and 12.0325 for phase 3. They may be higher or lower depending on your application. Either use linear scaling to calculate this figure or, if you’re not good with math, play around with different values until the load you have plugged in is shown on the energy meter’s screen.
Step 6: The Energy Meter in Operation


Once you have you energy meter calibrated and the scaling factors have been uploaded onto the Ardunio, your meter should be ready to connect and leave to monitor your energy consumption.
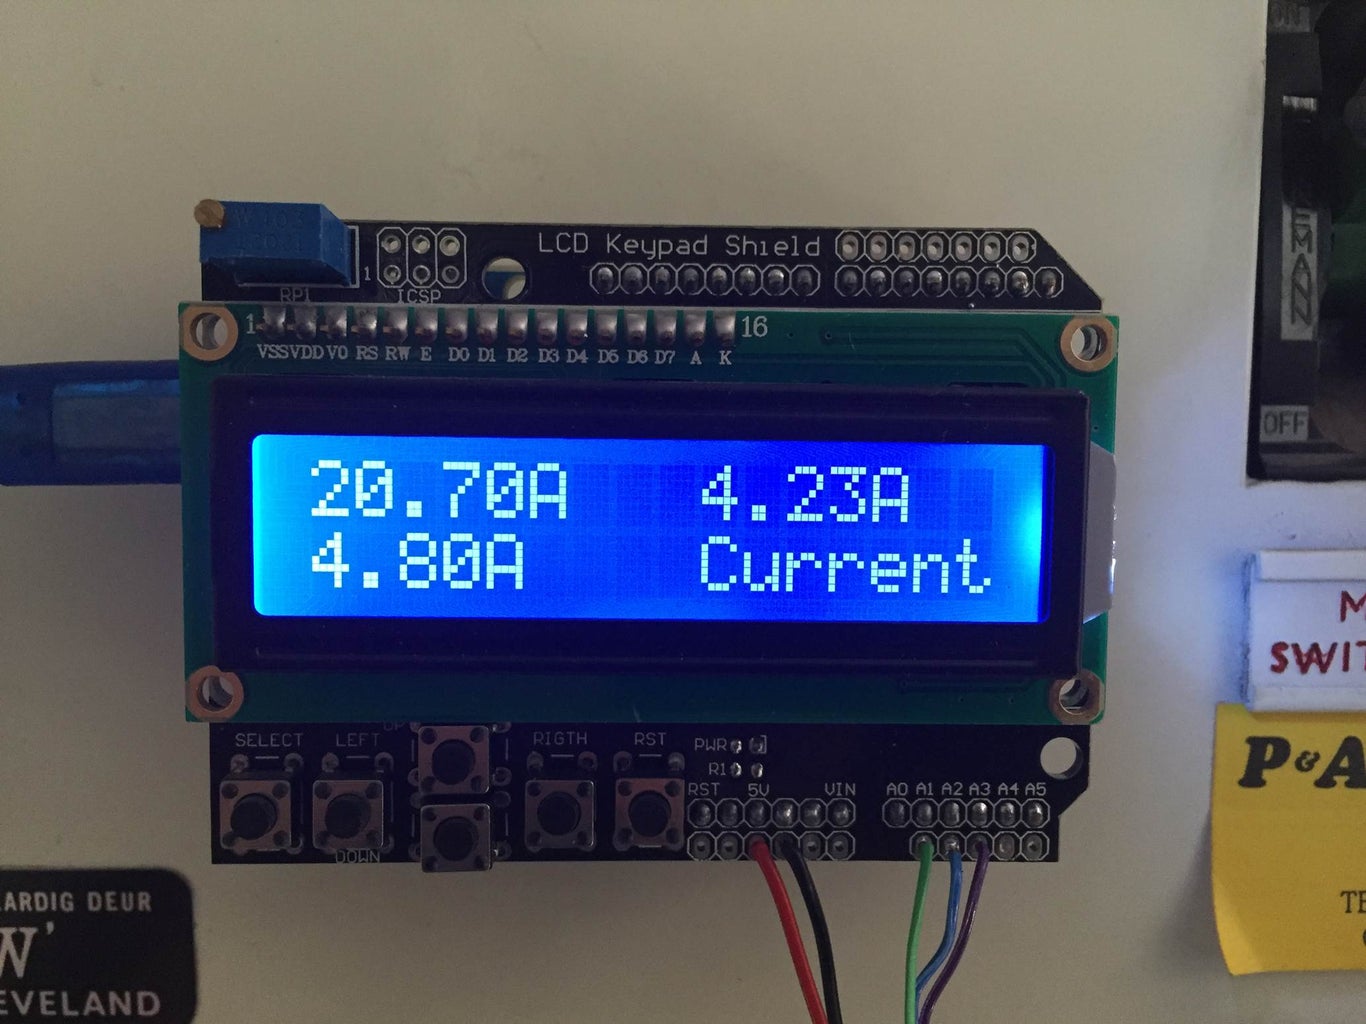
Upon startup, you’ll see a 3 Phase Energy Meter screen followed by cycling through the current, power, maximum power and kilowatt hours consumed screens. In each case, the top line displays phase 1 and phase 2’s measurements and the bottom line displays phase 3’s measurements.
Step 7: Autodesk Circuits Simulation
Here is the three phase energy meter modeled in Autodesk Circuits so that the code can be simulated. Note that they do not have provision for a CT so I have just used a waveform generator as an input which is triplicated onto all three CT inputs, the waveform generator is not really suitable so the displayed results are erratic.
The code also looks a bit different to the code supplied in the link, it is just the order of elements which is different, the content is the same. There is an issue with the way in which Circuits interprets the methods called up in the code which requires them to be declared before the main loop.
Hope you enjoyed this Instructable? If you did, please vote for it in the Microcontrollers contest. If you're looking for some different projects with step by step guides and code, have a look at these Arduino base projects which I've written.

Participated in the
Microcontroller Contest 2017


