Introduction: Get Out and Get Biking (or Scootering, Etc.)... an Experiment in Alternative Transportation


Everyone knows that one of the most harmful and un-green of the things that we do to the environment is drive our gas-guzzling cars everywhere we go. We complain about gas prices while we are driving our cars that get 8 miles to the gallon. One of the greatest ways to reduce your impact is to stop using your car! I know, it sounds impossible. It actually is rather easy when you use a different form of transportation.
In this experiment I only test manually powered vehicles. While electric vehicles are great, the majority of electric energy is produced by burning coal. I thought this took away a bit from the green-ness of it. The three vehicles I will be comparing to the car are a caster board (ripstick, wave), a scooter, and of course a bicycle.
Last thing before we get on to the actual experiment. I'd just like to say how great it is that Instructables is doing a "Green" contest. I'm going to make multiple entries (if that's allowed). I got this one done so quickly because I had already been doing it for a school project. Well, enough about that, lets get on to the experiment!
Step 1: The Testing Course

The course that I'm testing these on is the strip of road from the end of my street, to the neighborhood pool. It is almost exactly one mile long and has varying terrain (uphill, downhill, flat ground, turns, etc).
Each vehicle will get one overall time (the time it takes to run the entire course). In additon to the overall time, I'd like to time how long it takes each vehicle to do segments of the course, namely the uphill, downhill and flatground portions.
Step 2: Subjective?

In additon to the hard data I'm going to rank each one in certain categories, such as store-ability, steal-ability, and overall use-ability. This should be similar to the way Consumer Reports ranks their consumables. If you don't think that I did a very good job ranking them you can just go back to the data and make your own decision.
Step 3: Trying to Keep Things Constant

As with all good experiments, there should only be one independant variable. I want that variable to be the vehicle. In order to keep all of the other variables constant, I will be using each vehicle at top speed (not counting the car, which will be going at the speed limit). So that I don't get tired I'll take a ten minute break between each run. Any run that is interupted will be redone later.
Hopefully this will keep the results accurate.
Step 4: Car (Control)

The first test I ran was with the car, so that I could have something to compare the results to. The car is a 2001 Acura MDX. Driving at the speed limit, here are the results:
TOTAL TIME (One mile, Varied Terrain): 185 s
Flat Ground: 8s
Uphill: 5s
Downhill: 3s
NOTE: The distance of the uphill/downhill test is not equal to the flat ground test. These figures are intended for comparison to other vehicles.
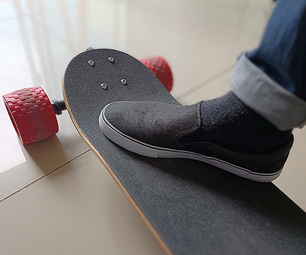
Step 5: Caster Board (Ripstick, Wave)

This second test is being done with a caster board. Common caster board brands are Ripstick, Wave, OBoard, and BladeBoard. These are a bit harder to learn but are fun to use. Anyway, here are the results:
TOTAL TIME: 1617 s
Flat Ground: 53s
Uphill: 57s
Downhill: 9s NOTE: I wiped out at the end of this run. Ripsticks do not make sharp turns well.
Step 6: Scooter

Ah, the scooter. I love using these. Most kids have ridden a scooter at one time or another. I'm using my brother's scooter for this test seeing as I do not have one. Here are the results:
TOTAL TIME: 814s
Flat Ground: 36s
Uphill: 15s
Downhill: 6s (No painful ending this time!)
Step 7: At LAST! the BIKE!

Finally we are here. The moment you've all been waiting for! The last test before analysis and conclusions! THE BIKE! Everyone has probably ridden a bike as a kid (or even as an adult). I think everyone I know has a bike of some sort, whether it be a family bike, a stunt bike, or (note the jealousy in my voice) a wicked awesome carbon-frame road bike. Here are the results I achieved using a bike:
TOTAL TIME: 436s
Flat Ground: 15s
Uphill: 10s
Downhill: 6s
Step 8: Analyze the Results
Now that all the tests have been completed, it is time to analyze the results.
The bike makes the best overall time of the alternative vehicles. It doubles the speed of the scooter, and goes at 4 times the speed of the ripstick. Of course, I've clocked the bike going far more than 4 times the speed but on a full mile run, trying to keep a pace, that is the result I get.
The scooter and the bike tie on the downhill run. The ripstick finishes a few seconds behind. The scooter's downhill speed sticks out compared to the others.
On the uphill run, the bike blows the other two away. The ripstick once again finishes in dead last. The uphill run has similar results to the flat ground run.
Step 9: Conclusion

In conclusion, for most commutes, the bike is your best option. It climbs hills far faster than the others which saves valuable time. The scooter can also take downhills quickly, but is comparable to the ripstick in the uphill climb.
The pro of the bike is that it saves you time on the actual commute. The con is that it probably can't be taken with you into your job and will have to be chained outside.
The pro of the scooter is that it is easy to fold up and take inside with you. The con is how long it takes to ride.
Finally, the ripstick may be fun to ride, but is difficult to learn and is very slow.
The spread sheet with all of the information can be downloaded or looked at here.
With this information you can make your decision on which green vehicle you will be riding. Please consider using one of these in place of your car whenever possible.
FINAL NOTES: In the science community, feedback is always important. It helps to come to a better conclusion by sharing results, ideas, and criticism. So please... feedback! Thanks in advance.
Attachments

Finalist in the
Discover Green Science Fair for a Better Planet