

Introduction: AC Current Monitoring Data Logger


Hi Everyone, welcome to my first instructable! By day I am a test engineer for a company that supplies industrial heating equipment, by night I am an avid technology hobbyist and DIY'er. Part of my work involves testing the performance of heaters, on this occasion I wanted to be able to monitor the RMS current draw of 8 devices over 1000hrs and log the data to graph the results later. I have access to a data logger but it was already committed to another project and I needed something low cost, so I decided to cobble together this basic datalogger.
The project uses an Arduino Uno to read analogue sensors via analogue to digital converter (ADC) and records the data with a time stamp on an SD card. There is alot of theory and calculation involved in designing the circuits, so instead of explaining absolutely everything, I will just show you how to make it. If your interested in seeing the FULL hit then let me know in the comments and I will explain further.
NOTE:
I've had alot of questions about True RMS calculations. This device uses a half wave rectifier to capture the peak of the wave, which can then be multiplied by 0.707 to give RMS. Concequently it will only give an accurate result with linear loads (i.e. the current being measured is a pure sine wave). Non-linear supplies or loads that give triangular, rectangular or any other non-sinus waveforms will not give a true RMS calculation. This device measures AC current only it is not designed to measure voltage, concequently it does not calculate or measure power factor. Please see my other instructable on how to create a power factor meter which can be used to do this. Many people have also said that a straight AC coupling with a 2.5V centreline is better, however this introduces complications as it involves having a sufficiently fast digital sampling rate, robust averaging/data smoothing, etc and the uncertainty this introduces is alot higher than measuring the raw value. Personally, I prefer hardware solutions and simpler code where possible so I'm not interested in that method. Accuracy wise I believe this is far better than the latter and you will see later in my results there is a regression coefficient close to 1.0 following calibration.
Step 1: Current Transformers


This project uses HMCT103C 5A/5MA current transformer. It has a 1:1000 turns ratio meaning for every 5A of current flowing through the conductor, 5mA will flow through the CT. A resistor needs to be connected across the two terminals of the CT to allow a voltage to be measured across it. On this occasion I used a 220 Ohm resistor, therefore using Ohm's law V=IR, the output of the CT will be 1.1 Volts AC, for every 5mA of CT current (or every 5A of measured current). The CT's were soldered to strip board with the resistor and some instrument wire to make flying leads. I terminated the leads with 3.5mm male audio jack plugs.
Here is the datasheet for the current transformer
Step 2: Signal Conditioning


The signal from the CT will be weak so needs to be amplified. For this I soldered together a simple amplifier circuit using a uA741 dual rail op amp. In this case the gain is therefore set to 150 using the formula Rf / Rin (150k / 1k). However the output signal from the amplifier is still AC, the diode on the output of the op-amp cuts off the negative half cycle of the AC and passes the positive voltage to a 0.1uF capacitor to smooth the wave into a rippled DC signal. Below are the parts that make up the circuit:
- V1 - This is arbitrary in this diagram, it simply represents the signal voltage which is fed into the non-inverting input of the op-amp.
- R1 - This is known as the feedback resistor (Rf) and is set to 150k
- R2 - This is known as the input resistor (Rin) and is set to 1k
- 741 - This is the uA741 intergrated circuit
- VCC - Positive supply rail +12V
- VEE - Negative supply rail -12V
- D1 - Is the haf wave rectifiying signal diode 1N4001
- C3 - This capactor holds the DC signal for a set time
In picture 2 you can see it was assembled using Veroboard and tinned copper wire. 4 hole were drilled for PCB stand off's so they could be stacked (because there are eight channels there needs to be eight amplifier circuits altogether.
Step 3: Power Supply


If you don't fancy making it from scratch then you can buy the board pre-assembled from China like the one pictured above, but you will still need the 3VA transformer (step down 240V to 12V). The one pictured cost me around £2.50
To power the project I decided to make my own dual rail 12VDC power supply. This was convenient as the op-amps require +12V, 0V, -12V, and the Arduino Uno can accept any supply up to 14 VDC. Below are the parts that make up the circuit:
- V1 - This represents the supply from the mains socket 240V 50Hz
- T1 - This is a small 3VA transformer I had lying about. It's important that the transformer has a central tap on the secondary which will be connected to 0V i.e. ground
- D1 to D4 - This is a full wave bridge rectifier using 1N4007 diodes
- C1 & C2 - 35V electrolytic capacitors 2200uF (has to be 35V as the potential between positive and negative will reach 30V)
- U2 - LM7812, is a 12V positive voltage regulator
- U3 - LM7912, is a 12V negative voltage regulator (be careful to note the pin differences between the 78xx and 79xx IC!)
- C3 & C4 - 100nF Smoothing capacitors 25V electrolytic
- C5 & C6 - 10uF ceramic disc capacitors
I soldered the components onto stripboard, and joined the vertical tracks with bare single core tinned copper wire. Picture 3 above shows my DIY power supply, sorry there's alot of jumpers in the photo!
Step 4: Analogue to Digital Converters

The Arduino Uno already has a built in 10-bit ADC, however there are only 6 Analogue inputs. Therefore I opted to use two ADC breakouts with the ADS1115 16-bit. This allows 2^15 = 32767 bits to represent voltage levels from 0-4.096V (4.096V is the breakout's operating voltage), this means every bit represents 0.000125V ! Also, because it uses the I2C bus it means that up to 4 ADC's can be addressed, allowing up to 16 channels to be monitored if desired.
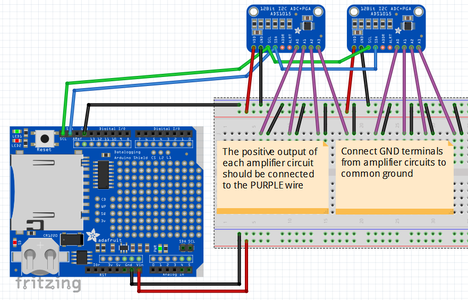
I have tried to illustrate the connections using Fritzing, however due to the limitations there is no custom parts to illustrate a Signal Generator. The purple wire is connected to the output of the amplifier circuit, the black wire next to it illustrates that all amplifier circuits must share common ground. So I have used a breadboard to illustrate how I've made the tie points. However my actual project has the breakouts sitting in female headers, soldered to Veroboard, and all the tie points are soldered onto the veroboard.
Step 5: Microcontroller

As mentioned above the controller I chose was an Arduino Uno, this was a good choice as it has alot of on board and built in functionality that otherwise would of needed to be built seperaturely. Plus it is compatible with alot of specially built 'shields'. On this occasion I required a real time clock to timestamp all the results and an SD card writer to record the results to a .csv or .txt file. Luckily, the Arduino data-logging shield has both in a shield that push fit's onto the original Arduino board without additional soldering. The shield is compatible with the RTClib and SD card libraries so no need for any specialist code.
Step 6: Assembly


I used 5mm ridgid medium/low density PVC (sometimes known as foamboard) to screw down most of my components and cut it to a convenient size with a craft knife. All the components were built in a modular fashion for the prototype as it allows for removal of individual parts if things go wrong, however it isn't as efficient or tidy as an etched PCB (further work) this also means alot of jumper wires between the components.
Step 7: Uploading Code
Upload the code to the Arduino, or get the code from my Github repo
https://github.com/smooth-jamie/datalogger.git
Attachments

Step 8: Calibration


Theoretically the measured current will be a result of several things combined:
Measured amps = ((( a *0.45)/150)/(1.1/5000))/1000 where 'a' is the signal voltage from the amplifier
0.45 is the rms value of the Vout of the amplifier circuit, 150 is the op-amp gain (Rf/Rin = 150k / 1k), 1.1 is full scale voltage output of the CT when measured amps is 5A, 5000 is simply 5A in mA, and 1000 is the amount of turns in the transformer. This can be simplified to:
Measured amps = ( b * 9.216) / 5406555 where b is ADC reported value
This formula was tested using the Arduino 10-bit ADC and a difference between multimeter values and Arduino generated values was observed by 11% which is an unacceptable deviation. My preferred method for calibration is to record ADC value vs Current on a multimeter in a spreadsheet and plot a third order polynomial. From this the cubic formula can be used to give better results when calcuating measured current:
(ax^3) + (bx^2) + (cx^1) + d
The coefficients a,b,c, and d are calculated in excel from a simple data table, x is your ADC value.
To get the data I used a ceramic 1k variable resistor (rheostat), and 12v transformer to step down the mains AC voltage from 240V, which will gave me generate a variable current source from 13mA to 100mA. The more data points collected the better, however I'd suggest collecting 10 data points to gain an accurate trend. The attached Excel template will calculate the coefficients for you, it's then just a matter of entering them into the arduino code
On line 69 of the code you will see where to enter the coefficients
float chn0 = ((7.30315 * pow(10,-13)) * pow(adc0,3) + (-3.72889 * pow(10,-8) * pow(adc0,2) + (0.003985811 * adc0) + (0.663064521)));
which is the same as the formula in sheet1 of the excel file:
y = 7E-13x3 - 4E-08x2 + 0.004x + 0.663
Where x = adc0 of whatever channel you are calibrating
Attachments
Step 9: Finish


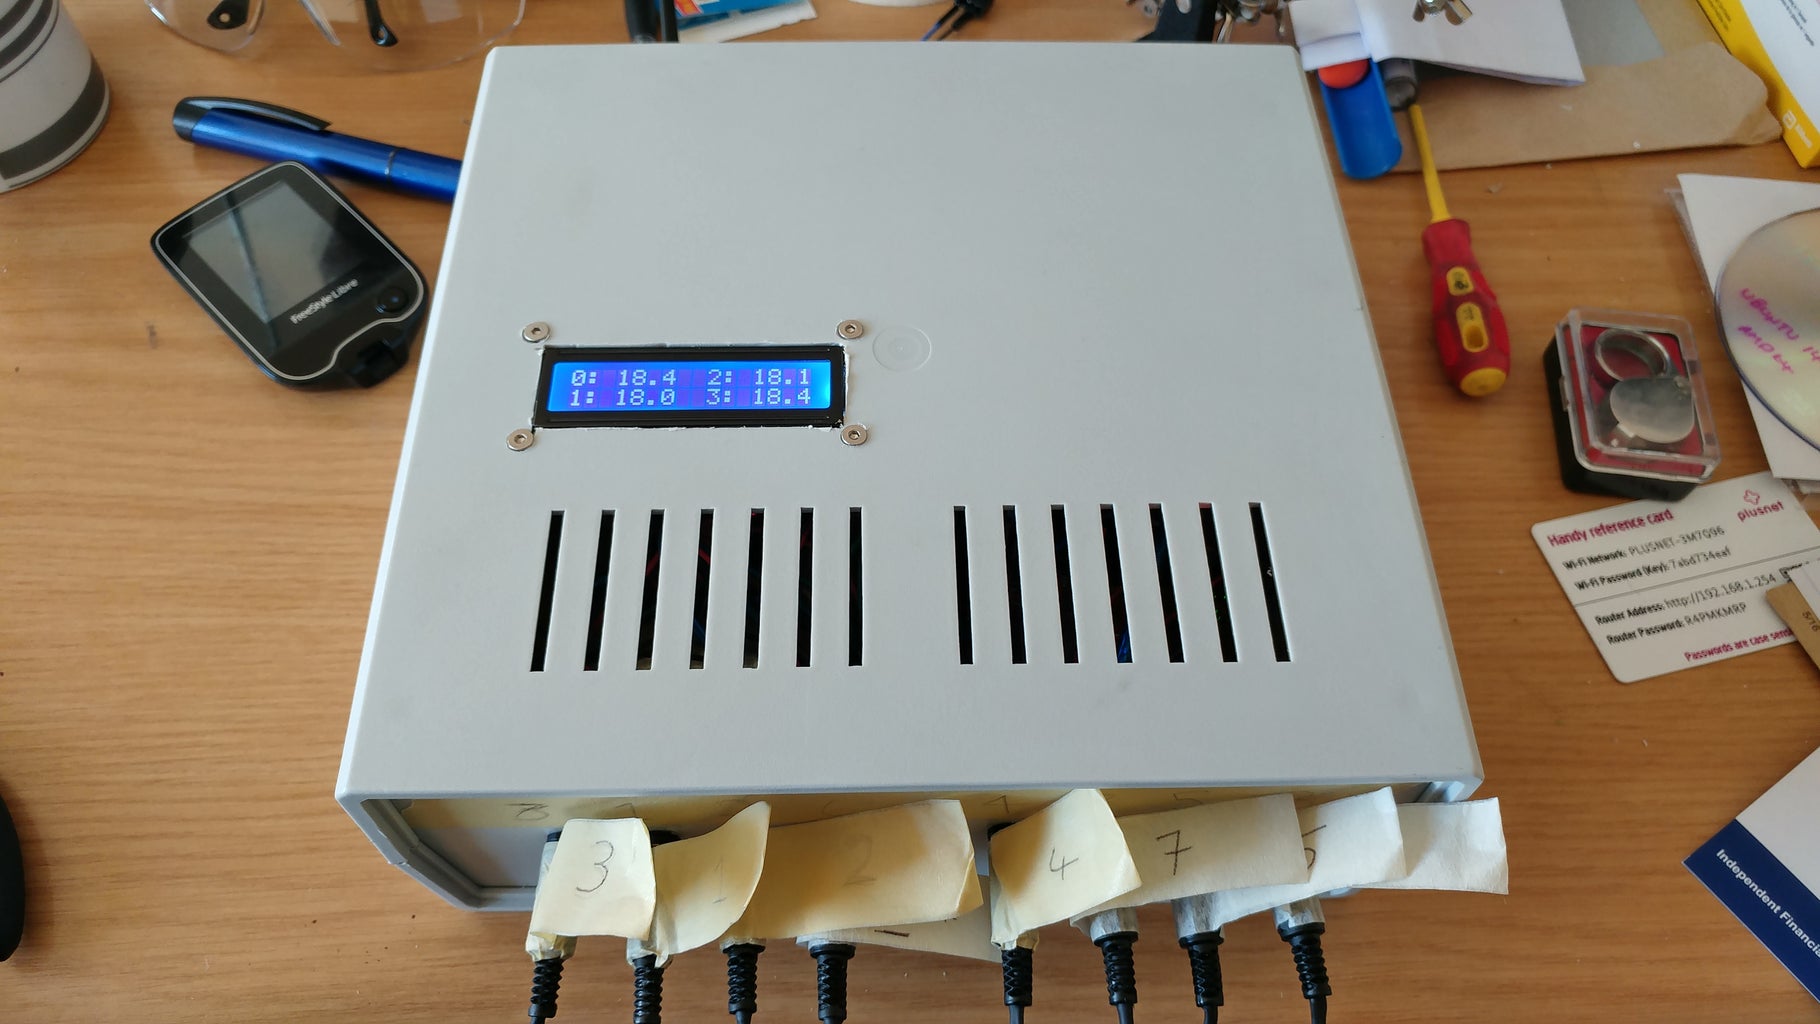
Put it in a project enclosure. I finished off the power supply with a toggle switch to turn the whole thing on/off at the supply, and an IEC "figure 8" connector for the mains input. Screw it all together and your ready to test it out.
Further work
The whole project was mocked up rather quickly so there is alot of room for improvement, etched circuit, better components. Ideally the whole thing would be etched or soldered onto FR4 rather than loads of jumpers. Like I said earlier there's loads of stuff I haven't mentioned but if there is something specific you would like to know let me know in the comments and I will update the instrucable!
Update 18/12/2016
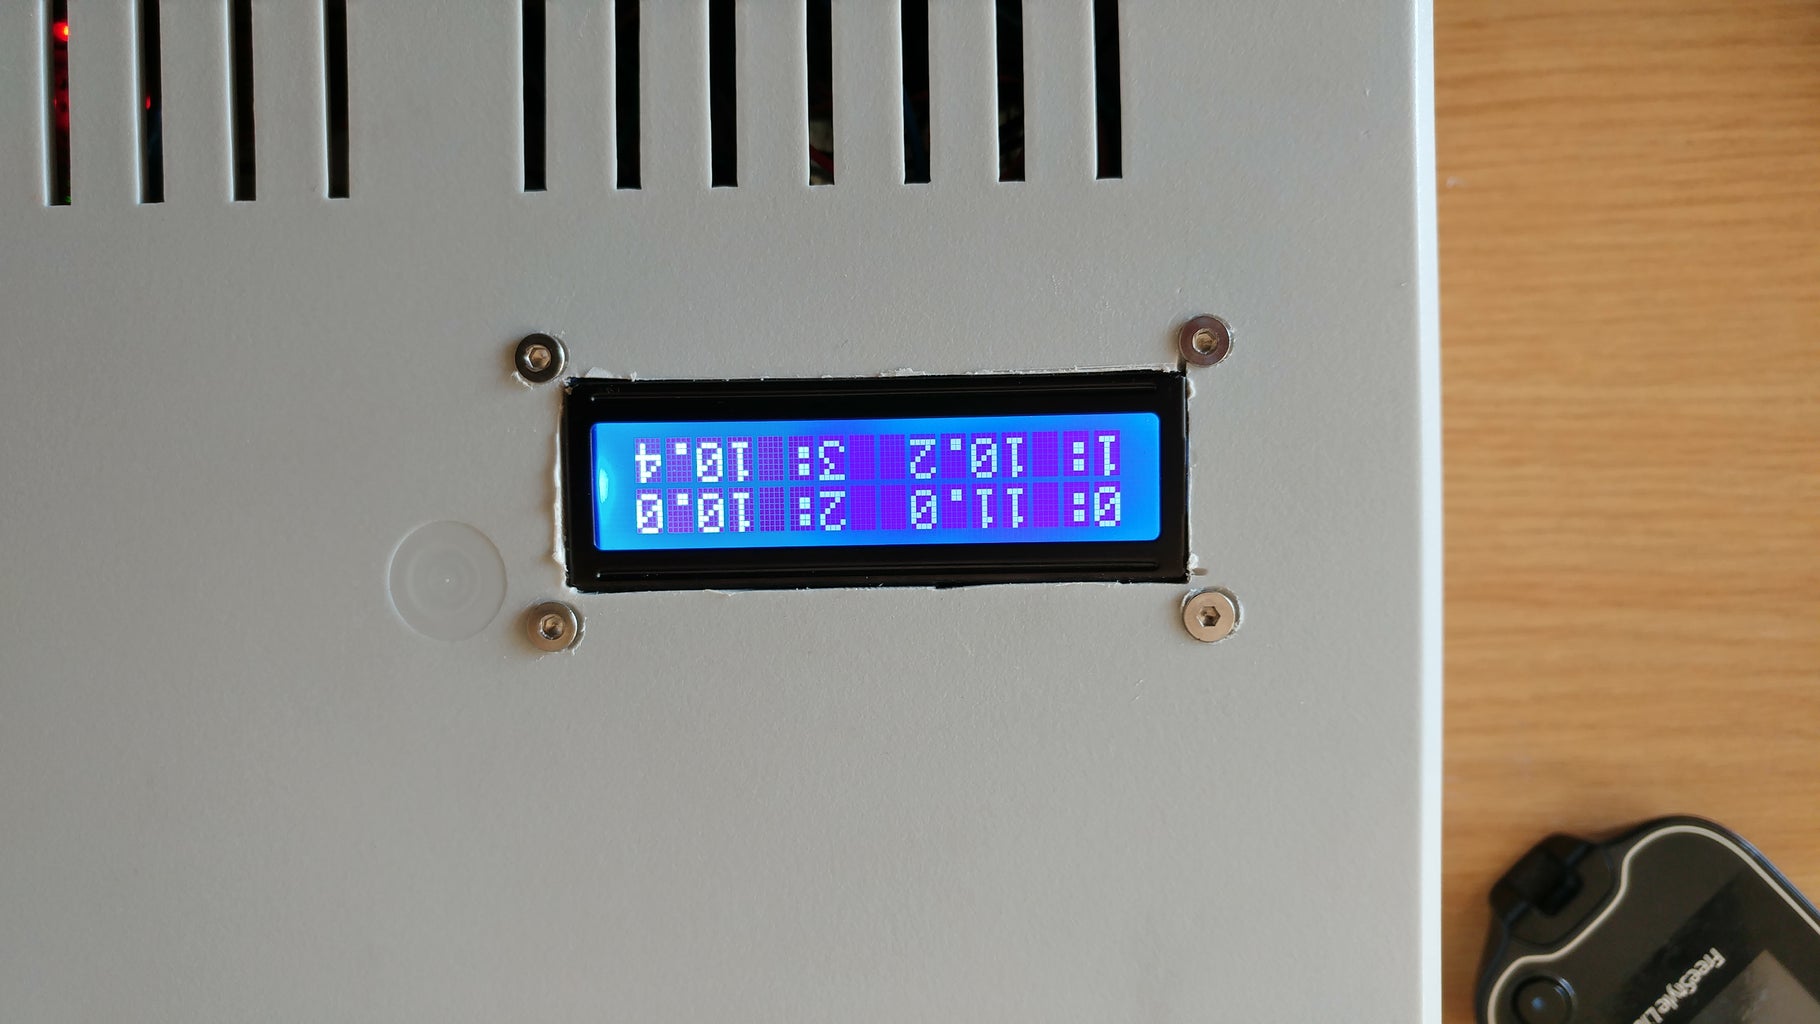
I have now added a 16x2 LCD using the I2C "backpack" to monitor the first four channels, will be adding another to monitor the last four when it arrives through the post.
Credits
This project was made possible by all the authors of the Libraries used in my Arduino sketch including the DS3231 library, Adafruit ADS1015 library and the Arduino SD library

Participated in the
Arduino Contest 2016

Participated in the
First Time Authors Contest 2016


