

Introduction: DIY ECG EKG Portable Heart Monitor


Trying to capture a trace of my very occasional heart palpitation has proven to be nearly impossible. Being keen on electronics, I thought I would make my own ECG (ElectroCardioGram) monitor.
This is intended to be a fun project, not a replacement for a proper ECG. A hospital ECG will likely be a "12 lead" monitor (which actually only has 10 leads due to sharing). This monitor has just two leads, which are placed over bony areas of the chest (sternum and lower-left rib).
The project was fun - circuit design, PCB manufacture, Arduino coding, datalogging, LCD screen, 3D printing, data analysis, etc.
This is not intended to be a full, step-by-step guide. I think you really have to know a little bit about what you are doing in each area listed above. I will try to give enough information to give people the confidence to have a go. There is nothing particularly hard here. This is not a finished, polished piece of kit - more a fully-working prototype.
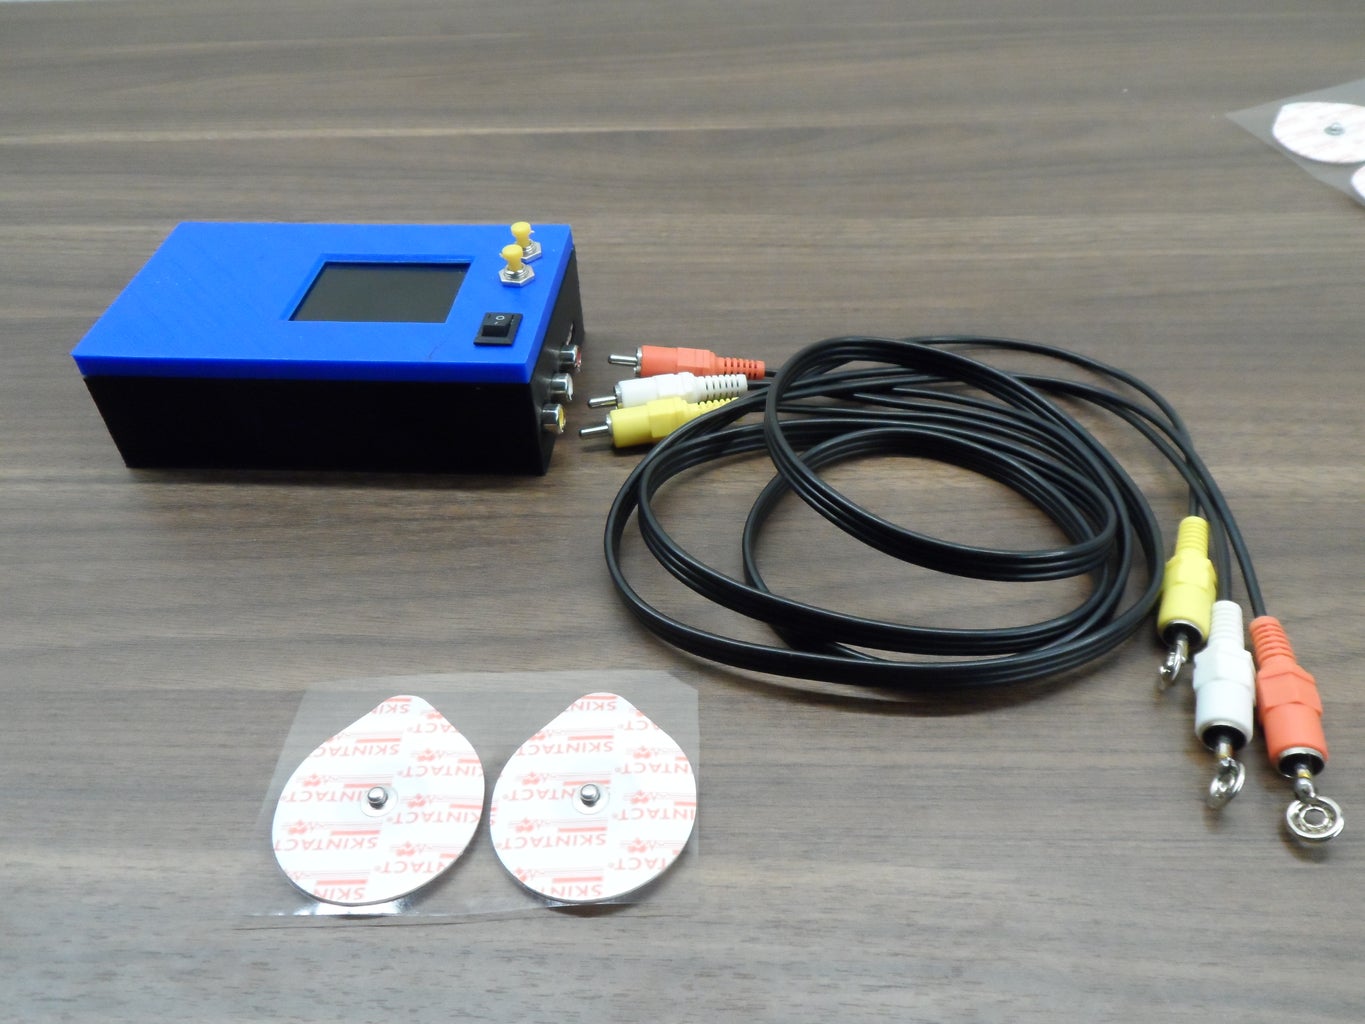
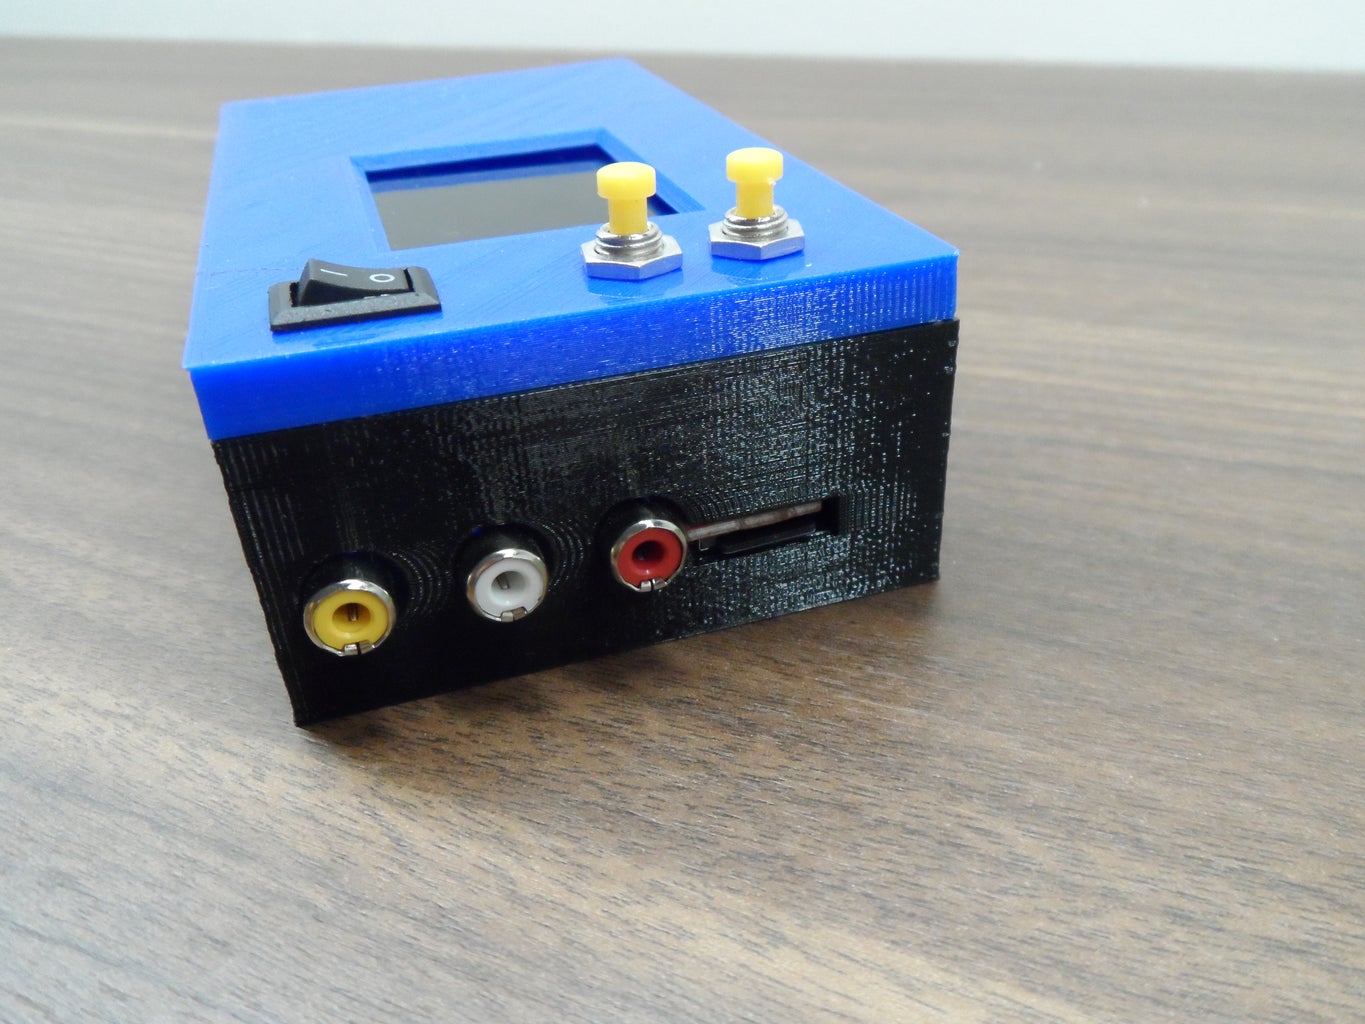
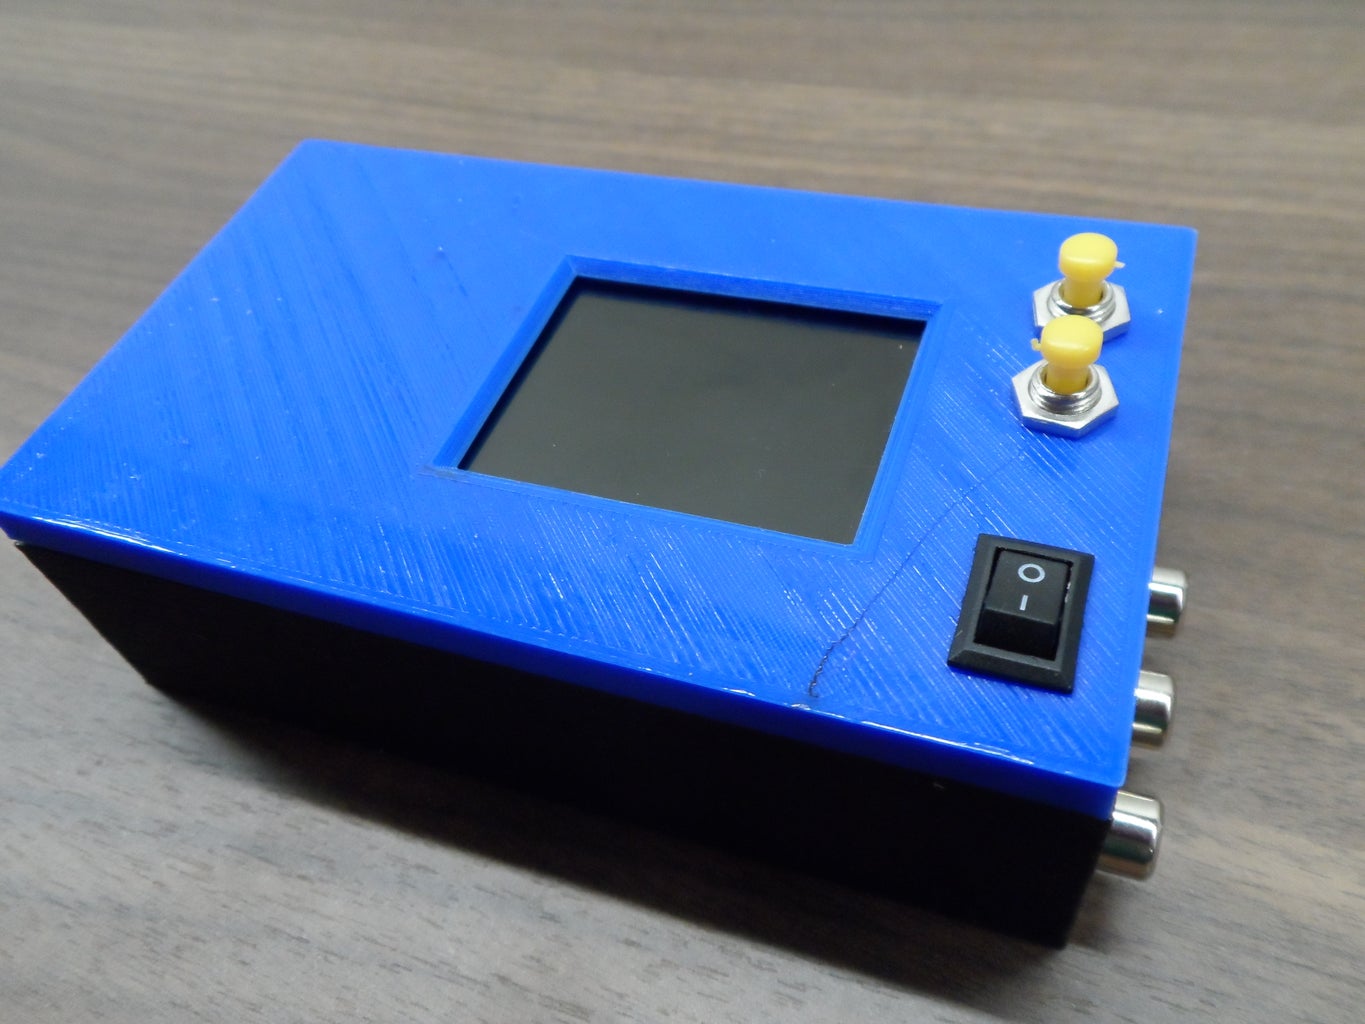
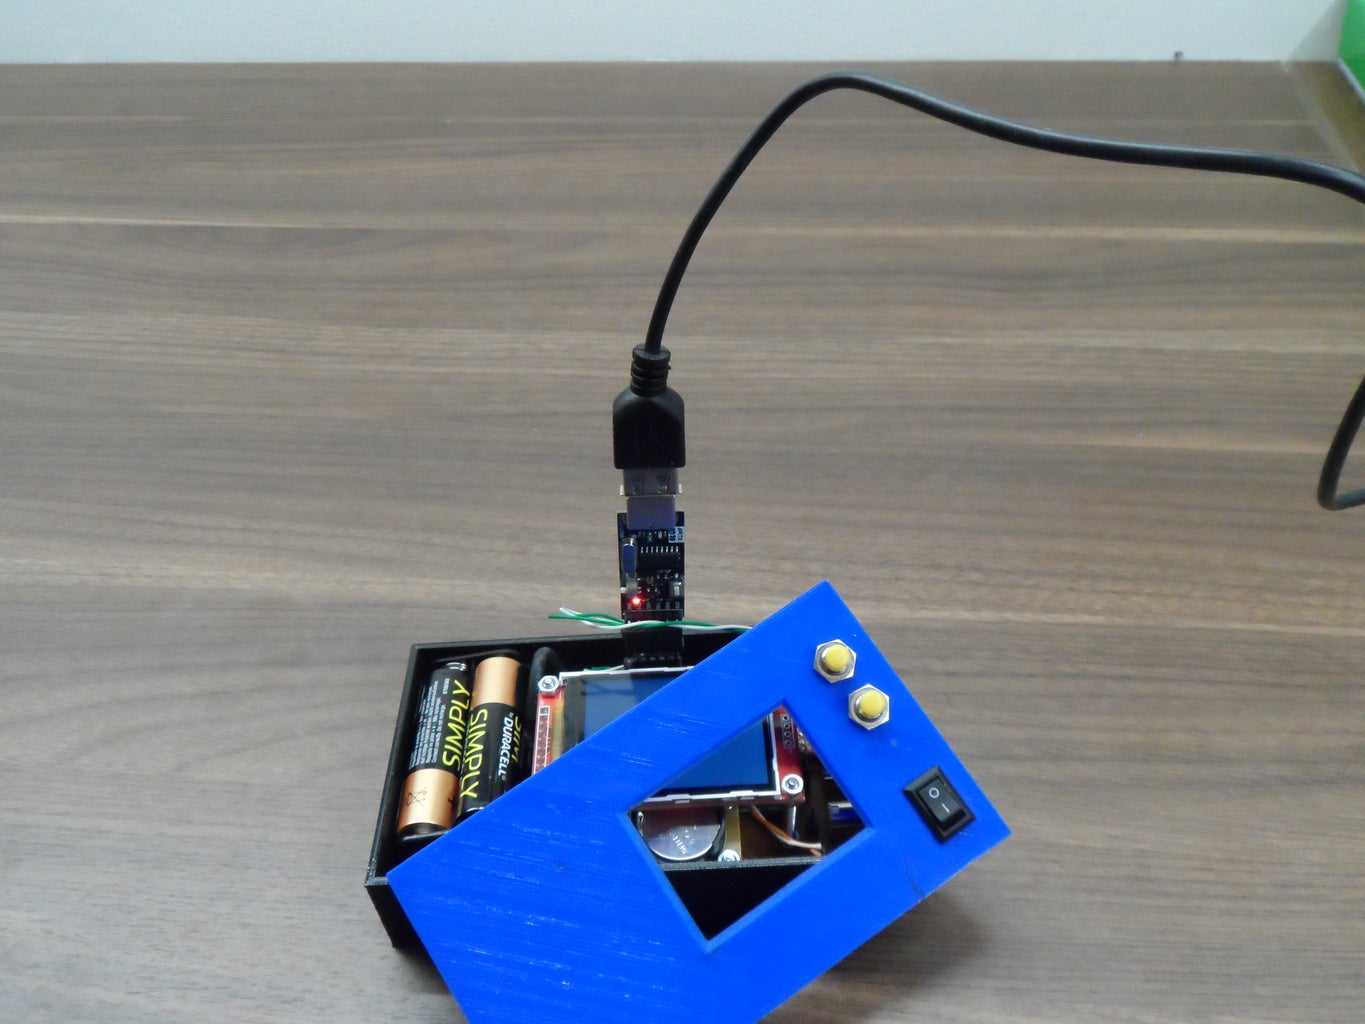
The finished project, consists of a portable plastic box, with a colour LCD screen which shows the live ECG trace. It has connectors for the electrodes and has a slot for a micro SD Card which stores the data. There are four AA cells inside the box - it is fully self-contained. It has a real-time clock so that the heart data can be labelled with time-of-day and date.
The SD Card holds the voltage data which forms the ECG trace. There is no indication of absolute voltage, but there is an accurate 1-second time-base embedded in the data. The data is stored as a plain text string of numbers, each on a separate line (ie CSV). It imports straight into a spreadsheet.
Safety is paramount, don't put electrodes on your body when they are in electrical contact with ANYTHING connected to the mains (including the USB Arduino Programming lead). Be wary of similar projects which use a serial monitor to display the results - possibly connecting your body to the mains via a USB lead.
Disclaimer: Never connect this project to your body without having the finished project comprehensively checked by a fully-trained medical equipment technician. Ask him/her to issue you with an electrical safety certificate.
December 2021 addition:
If you are thinking of making this sort of project - take a look at this Instructable published in March 2021. It might be good....
https://www.instructables.com/ECG-Display-With-Ard...
Step 1: Overview

The diagram shows the basic functionality.
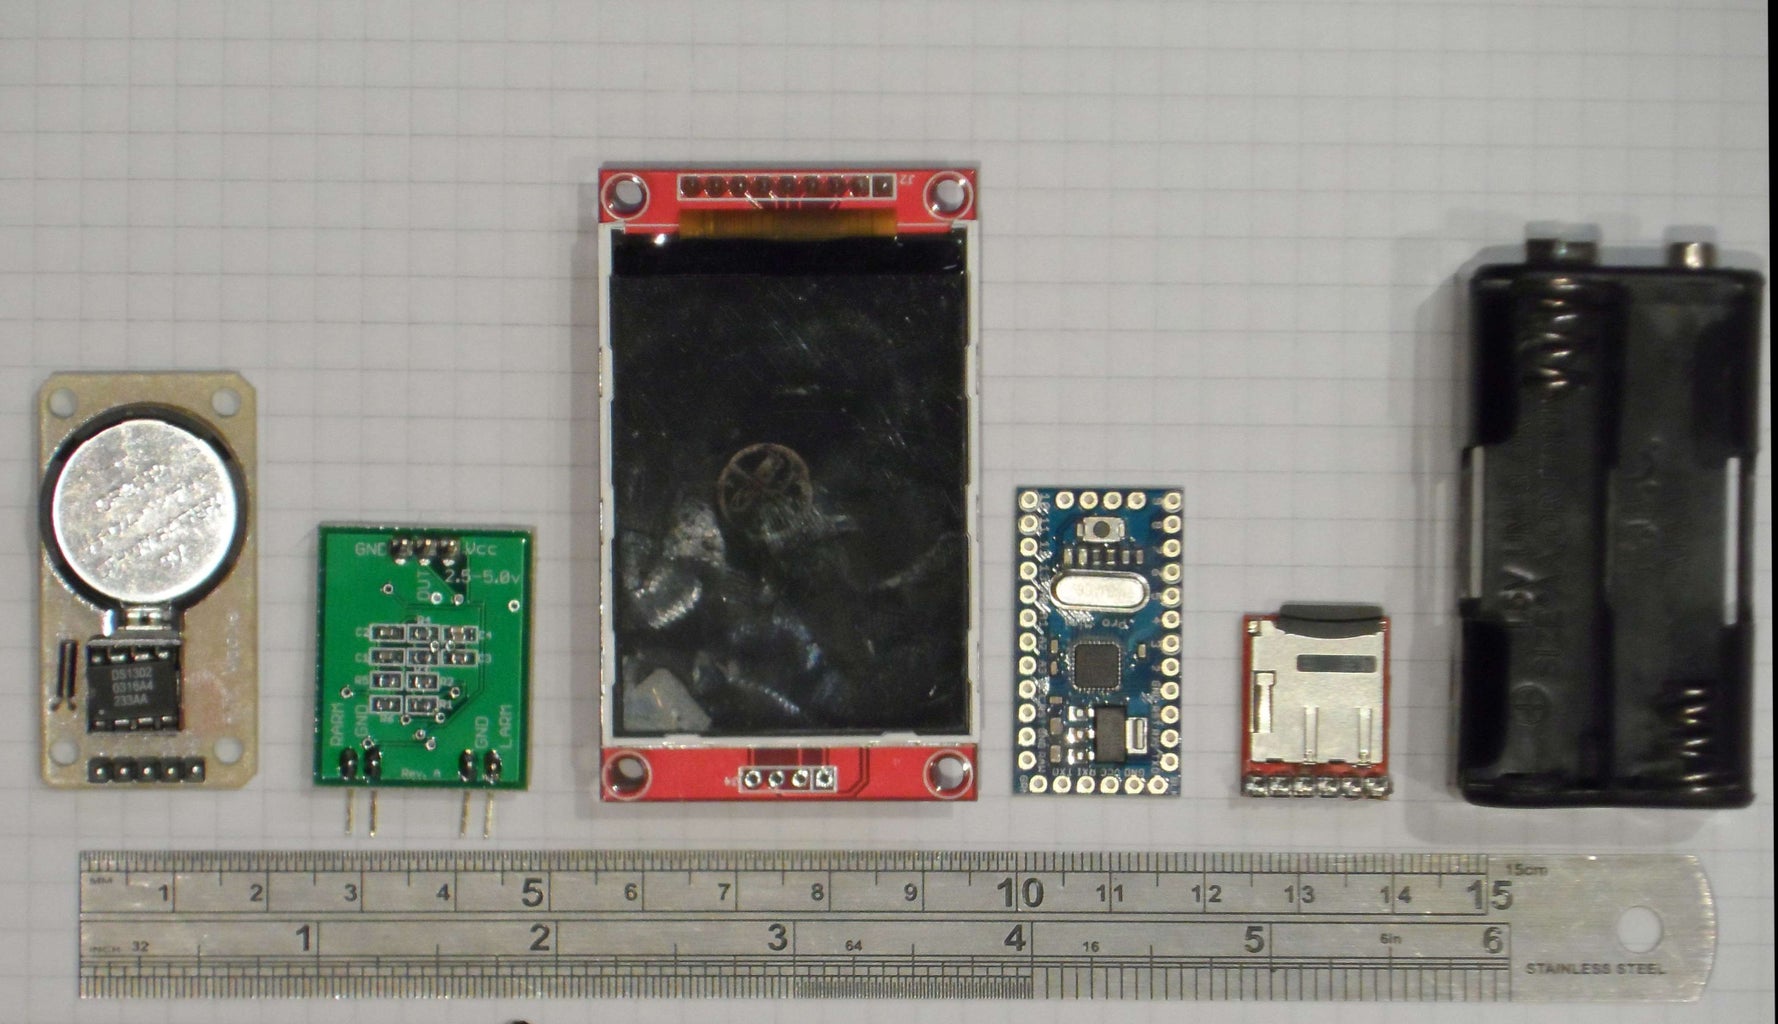
The photograph shows the main commercially bought modules (Left to right: Real Time Clock; ECG Front End; Colour LCD Screen; Arduino Pro Mini; OpenLog; Battery Holder)
ECG Front End
The whole project is built on an ECG front end available from "100RandomTasks" (cost=22CAD, around £13 GBP)
http://www.100randomtasks.com/ecg-front-end
This brilliant, tiny circuit board, does all the hard work in processing the minuscule heart signals, rejecting the electrical noise, and amplifying the heart trace signal to a voltage which is perfect for feeding into an Arduino. It is possible that an alternative would be the AD8232 heart monitor module which has become available.
Datalogging
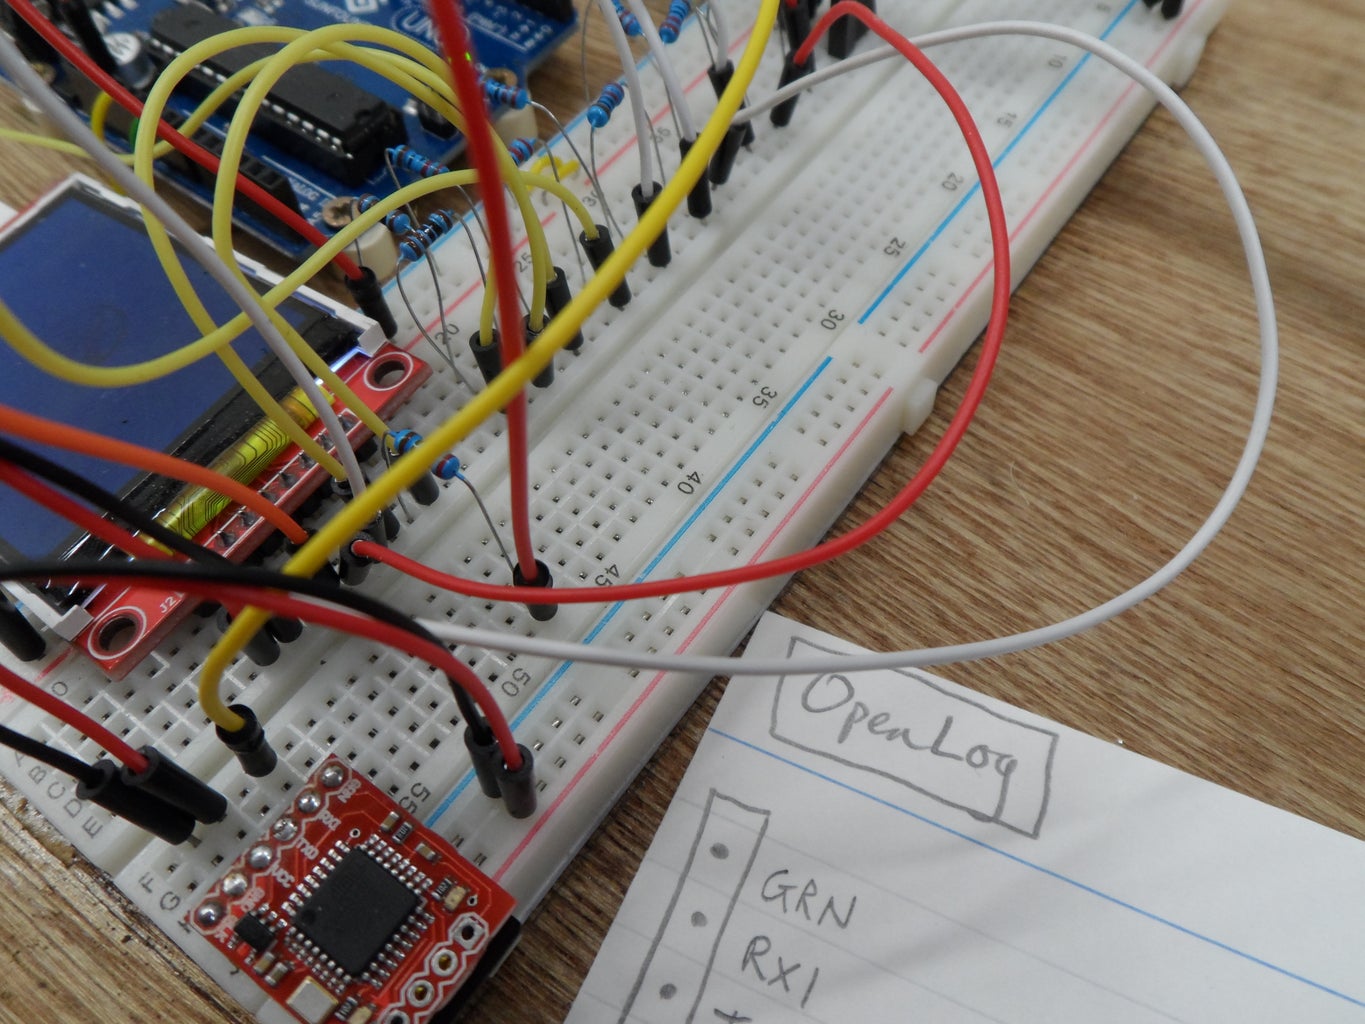
The Datalogging aspect was very simply achieved using an "OpenLog" circuit board - available from lots of suppliers (£4 from China £12 from UK) - just search for OpenLog in Google an/or Ebay. OpenLog does everything necessary to put the data onto the SD Card. The SD Card holds the heart's voltage data which forms the ECG trace. There is no indication of absolute voltage, but the Arduino provides an accurate 1-second time-base which is embedded in the data. The data is stored as a plain text string of numbers, each on a separate line (ie CSV). It imports straight into a spreadsheet. OpenLog is an absolutely brilliant tool for getting virtually any data onto a Micro SD card - fantastic.
Cost
Most people are interested in the minimum cost. If you buy everything on ebay and order from China the main components cost (2018 prices)
- £5.20 TFT display
- £2.25 Real Time Clock module
- £1.50 Arduino Pro Mini
- £3.50 OpenLog
- £13.00 ECG Front End (from Canada)
There is now an AD8232 heart monitor available for £3.60 from China which might be an alternative to the ECG Front End that I used.
Chinese rip-offs are not recommended, especially if you want guaranteed quality components and make use of library code developed by the original suppliers who deserve support.
Obviously, there are other costs:
- SD Card
- Discrete components, connectors and batteries
- PCB manufacture materials
- 3D print materials
- Medical grade electrodes
It is quite a while since the parts were purchased - study the photo of the modules to see what was used here - there is nothing 'special'.
Step 2: Circuit Design


As you can see from the circuit schematic, most of the circuitry is dealt with by the plug-in modules and doesn't appear on my schematic. All of the purchased modules (RTC, ECG, Arduino, OpenLog, TFT) simply plug onto the connectors on the schematic. There are also connectors for the on-off switch, two buttons, batteries, etc.
The schematic contains two errors.
- Note 1 - the TFT requires 3V signals, but the Arduino runs at 5V. I have put a simple (!) potential divider circuit made up of two resistors to drop the voltage. Somehow I got the wiring wrong - doh! I corrected the mistake by slightly rearranging the layout of the resistors when I soldered them onto the board. The necessary correction is shown in the second diagram, just swap A for A, B for B, etc.
- Note 2 - The ground pin 10 from the Arduino, should go to ground! Again, corrected by tweaking the PCB (Must have been a late night)
The heart signal voltage output is read by one of the Arduino's analogue input pins. The RTC, TFT and OpenLog all have serial communications with the Arduino. There is provision in the circuit for the Arduino to use an external voltage reference from a zener diode, instead of the internal reference voltage. This was never used and the components were not fitted.
To reduce current consumption, the LEDs in the TFT display can be switched off by one of the pins of the Arduino and an accompanying VFET.
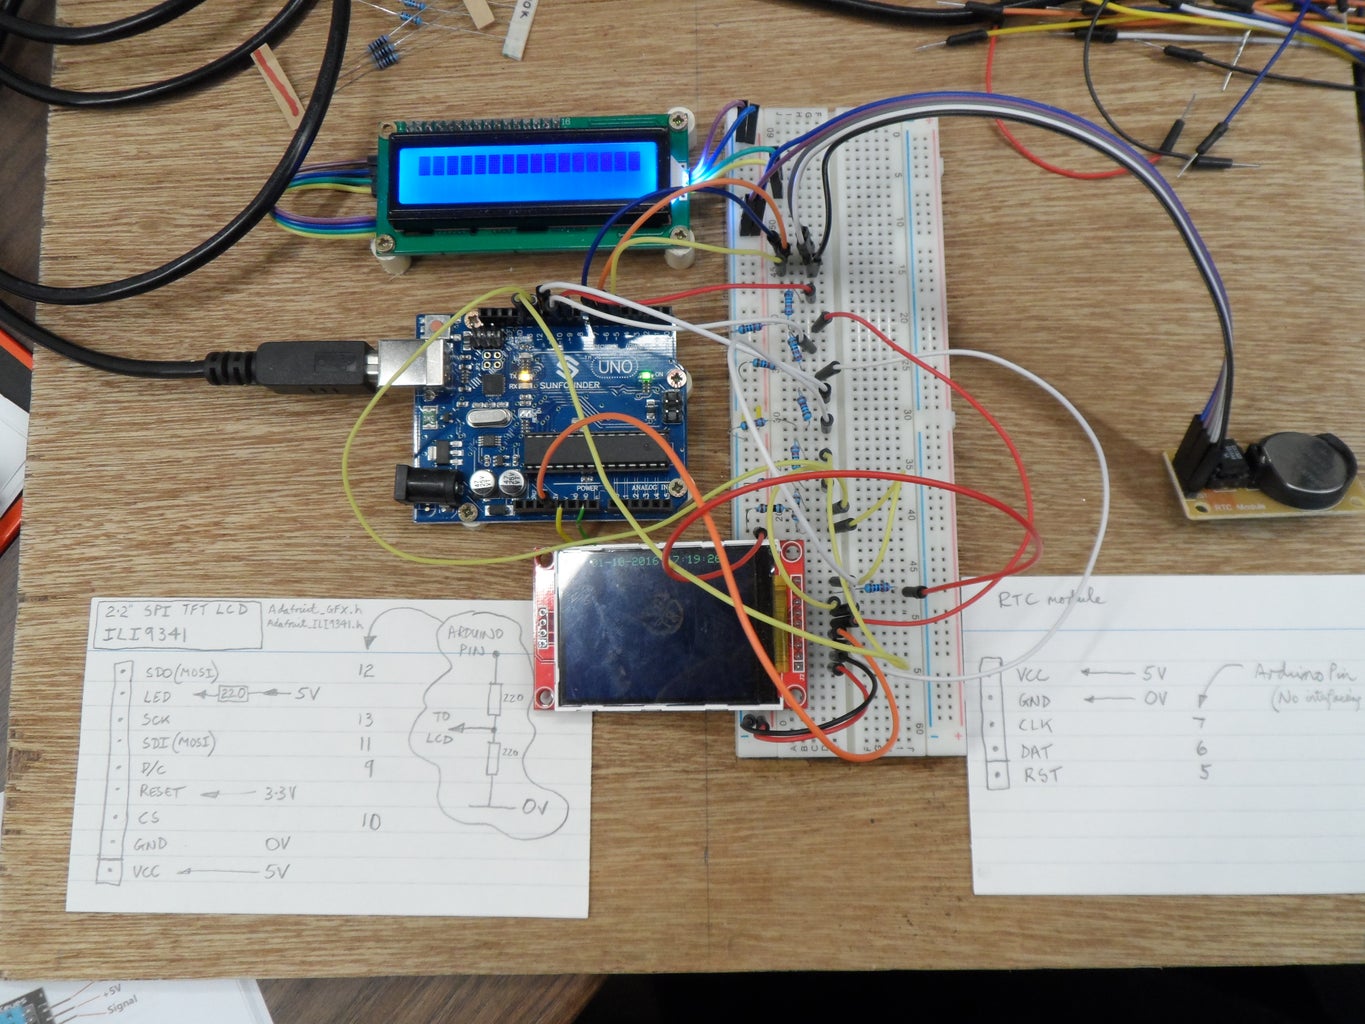
The 'usual' prototyping on a breadboard was carried out to check on the way in which the various modules work. The photos show the RTC, TFT and OpenLog being checked-out.
Step 3: PCB Design and Manufacture


KiCAD was used for the circuit design. The files are not available here because there are so many dependencies (custom parts, custom pinout designs, libraries, etc) that too many individual files would have to be supplied.
The PCB is a single sided design with the components and six wire bridges on the top side and the tiny VFET soldered on the copper side.
The PCB was made with a UV sensitive resist board and a transparency with the traces printed on.
The resulting copper layer was mediocre and required some patching - not my best work, but functional.
A PDF of the final board design is supplied (but remember the circuit errors noted in the previous step). The dimensions of the fine black line surrounding the artwork (ie the board cut-line) are 85.04mm x 68.38mm
Attachments

Step 4: Assembling the ECG
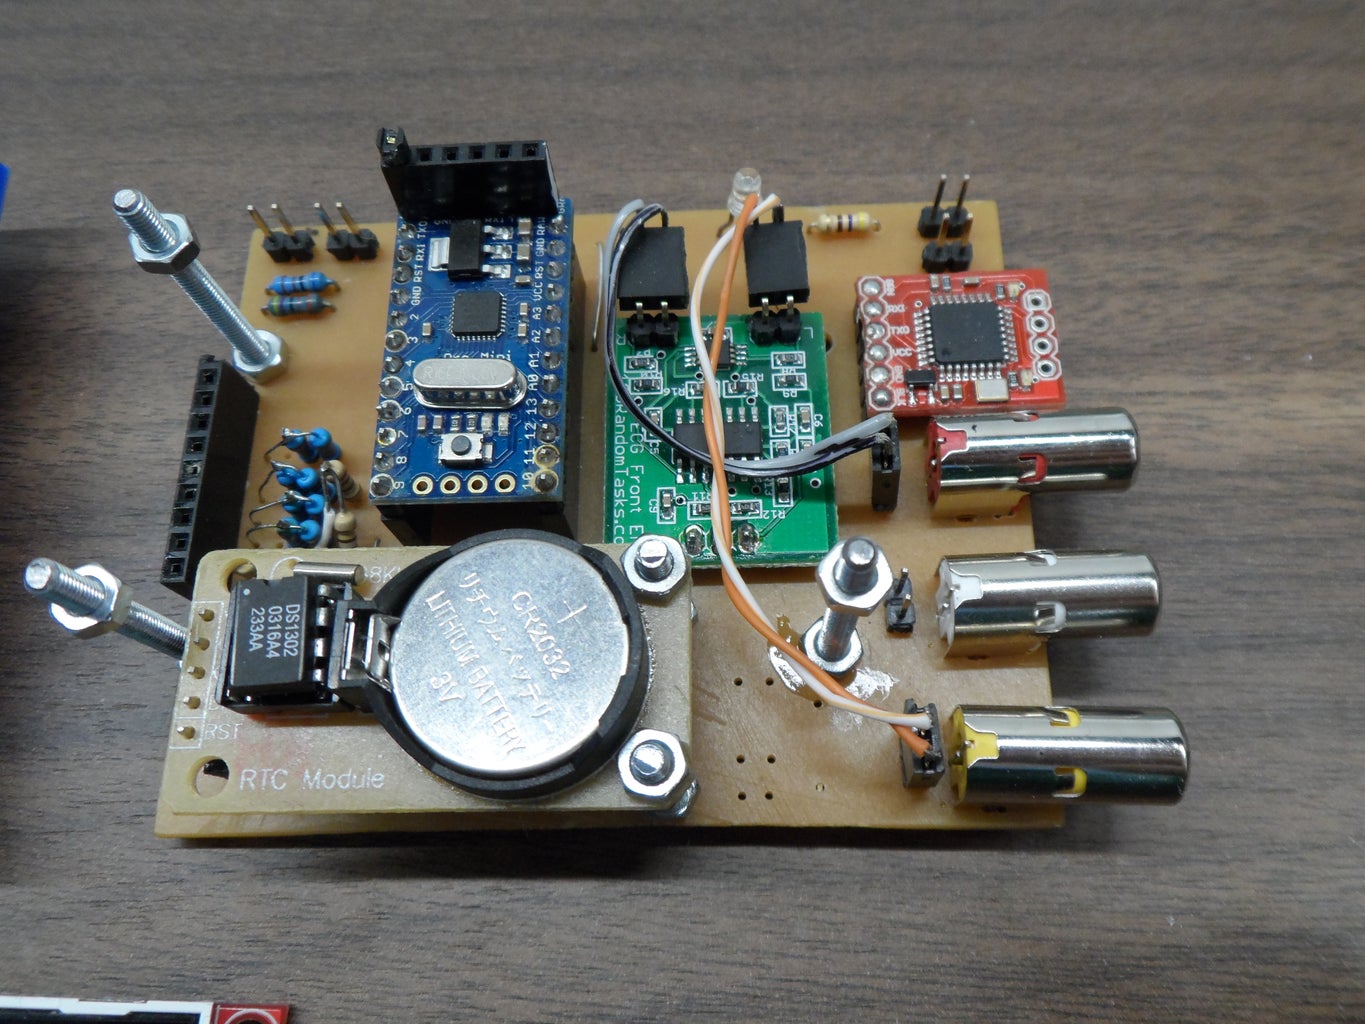

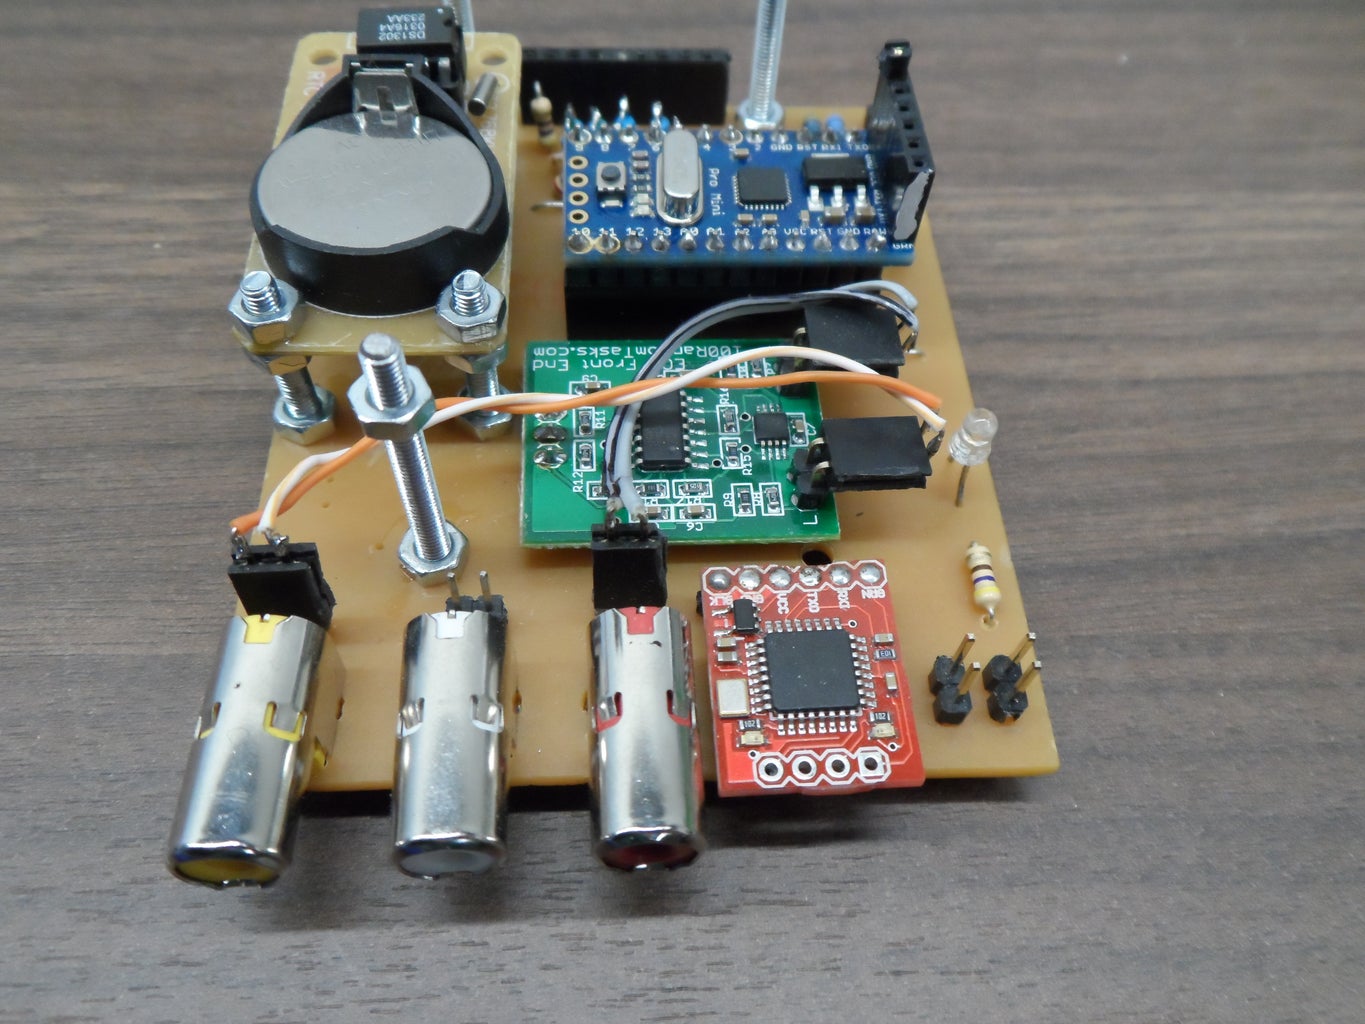
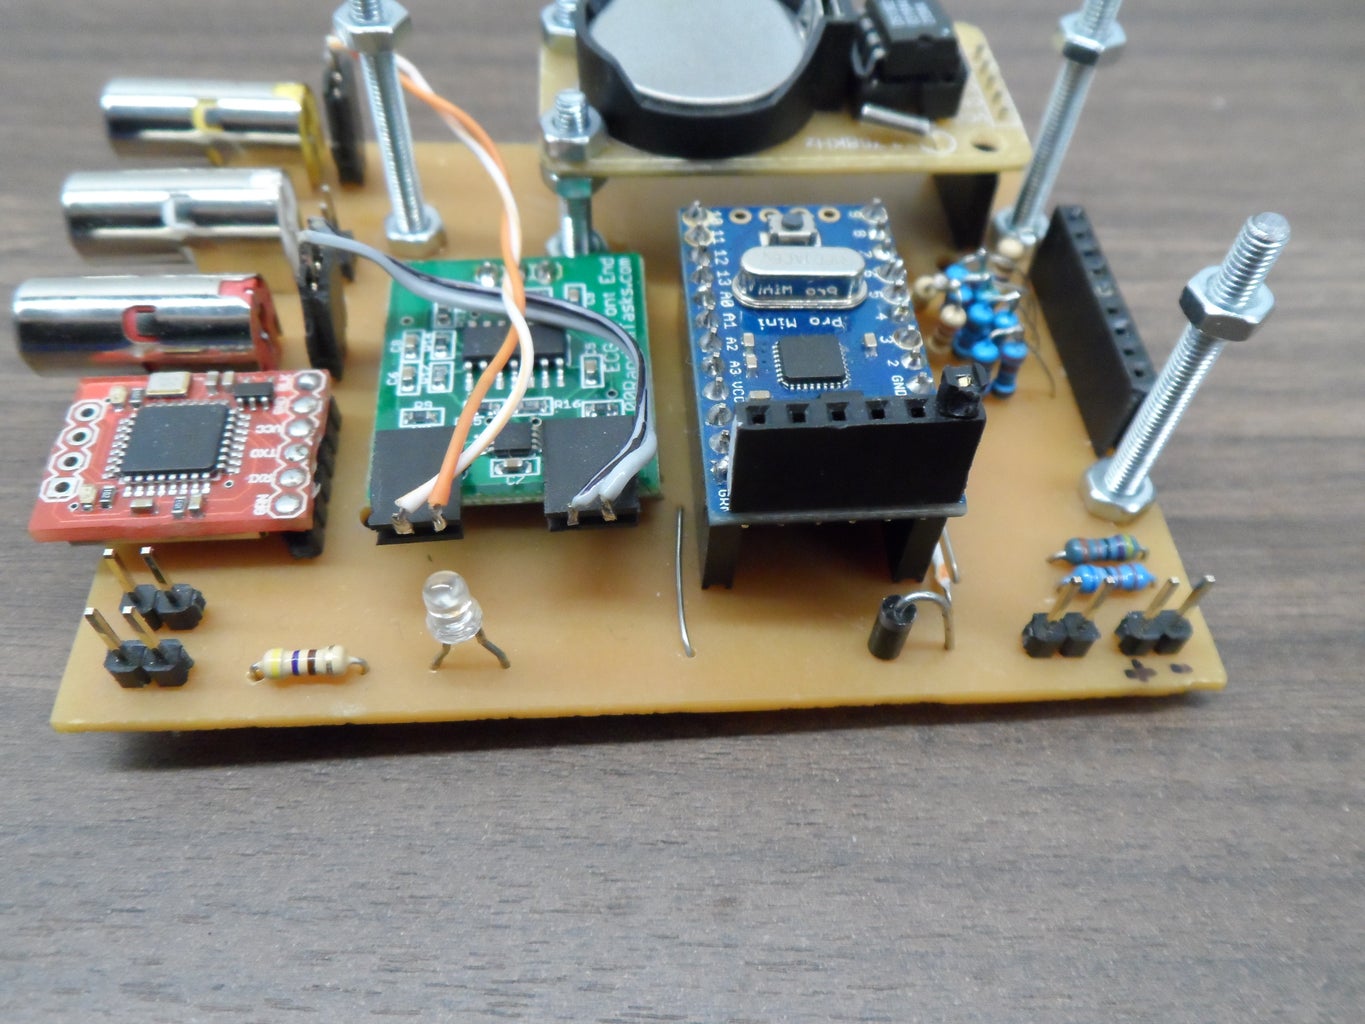
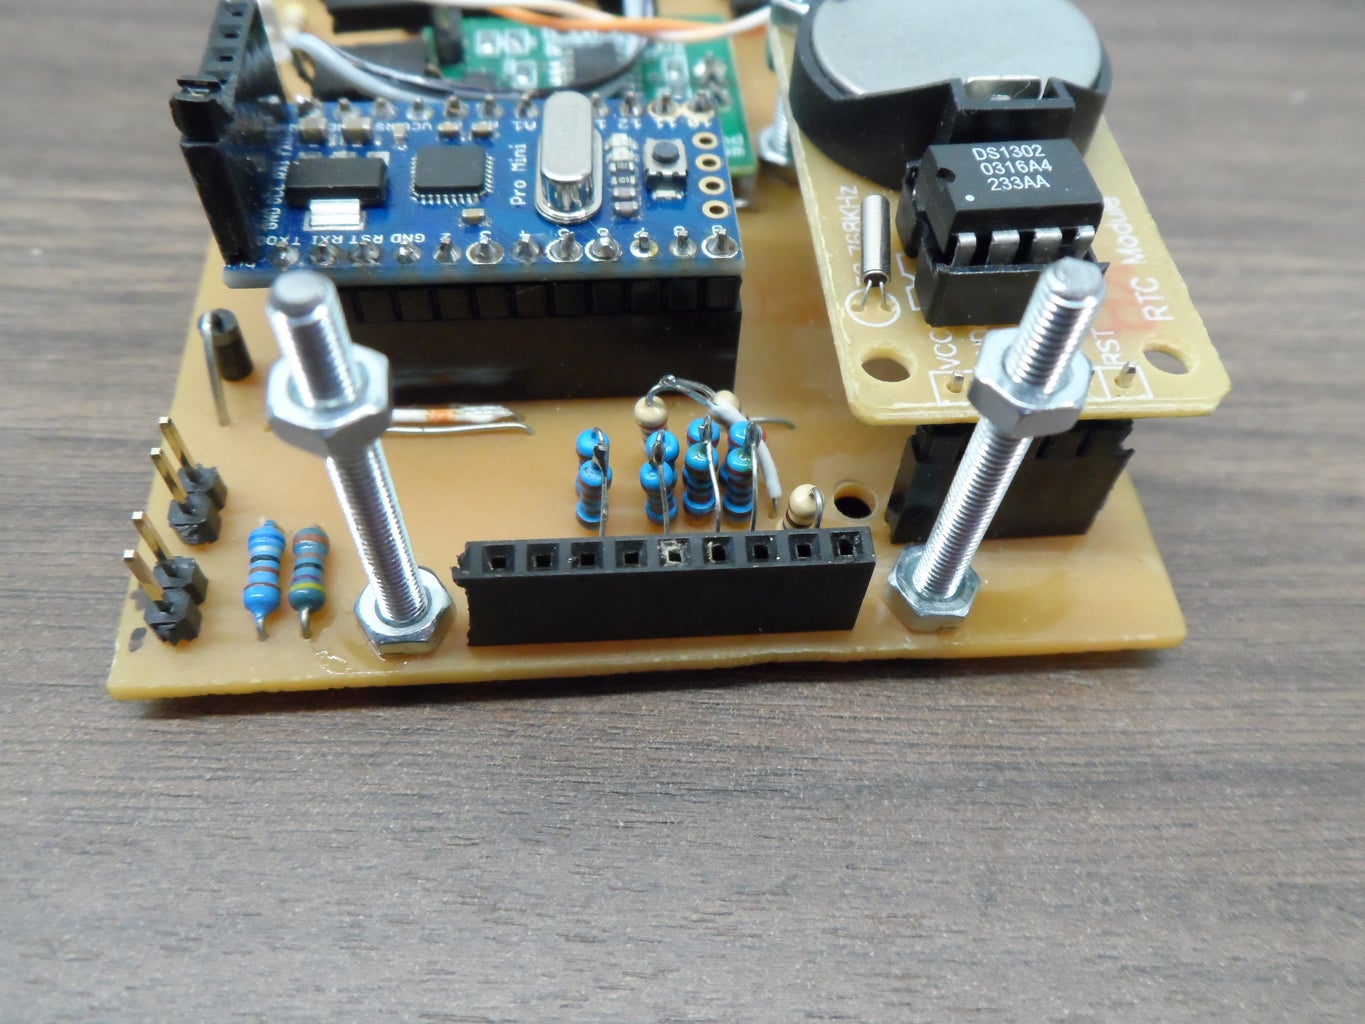
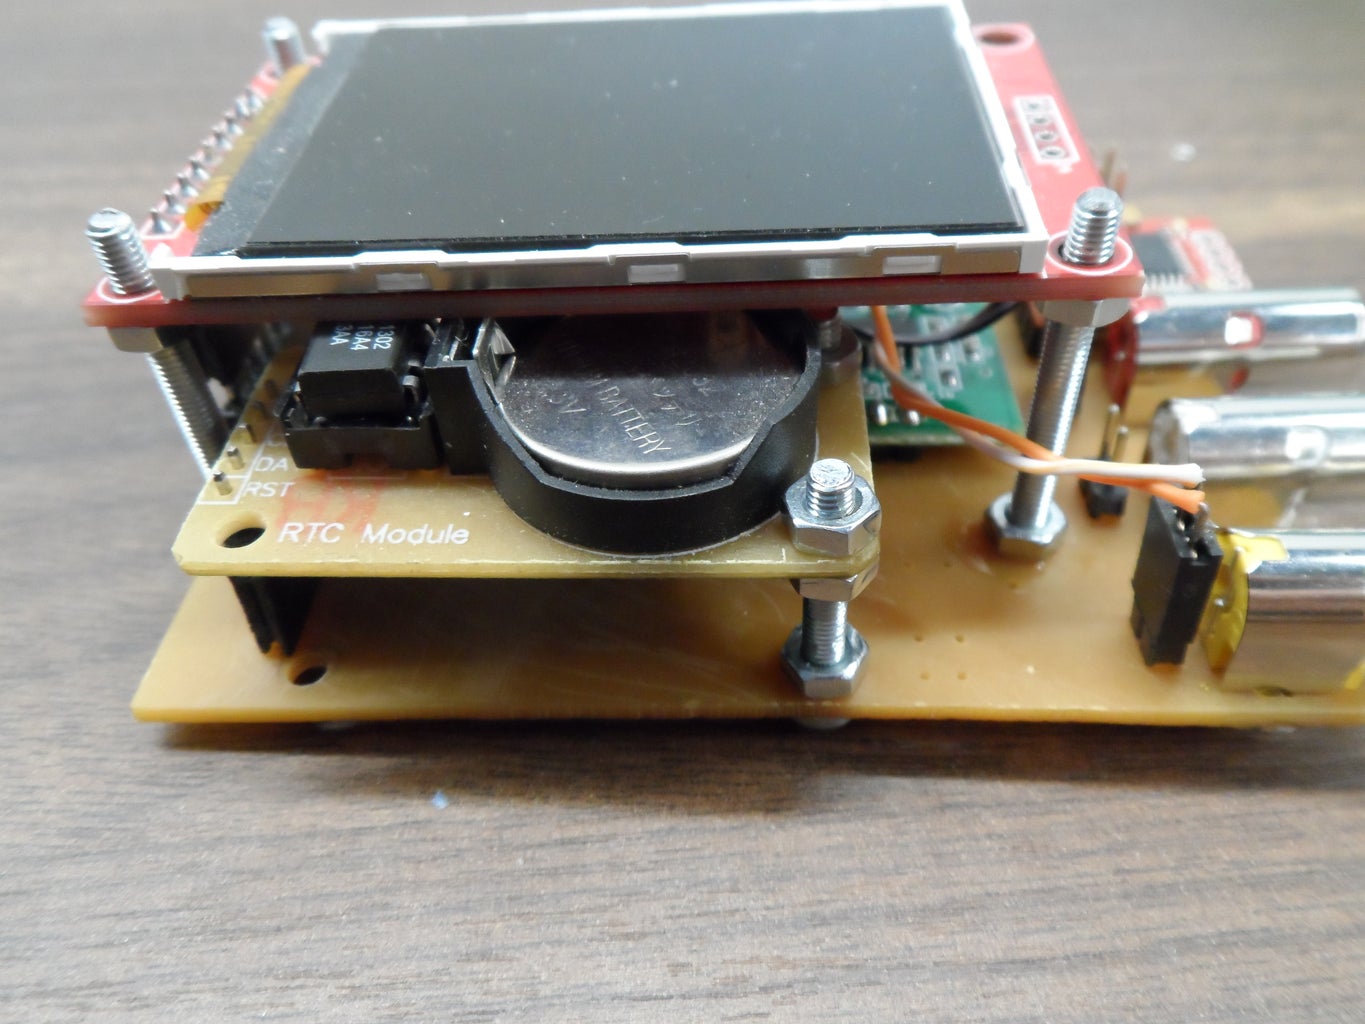
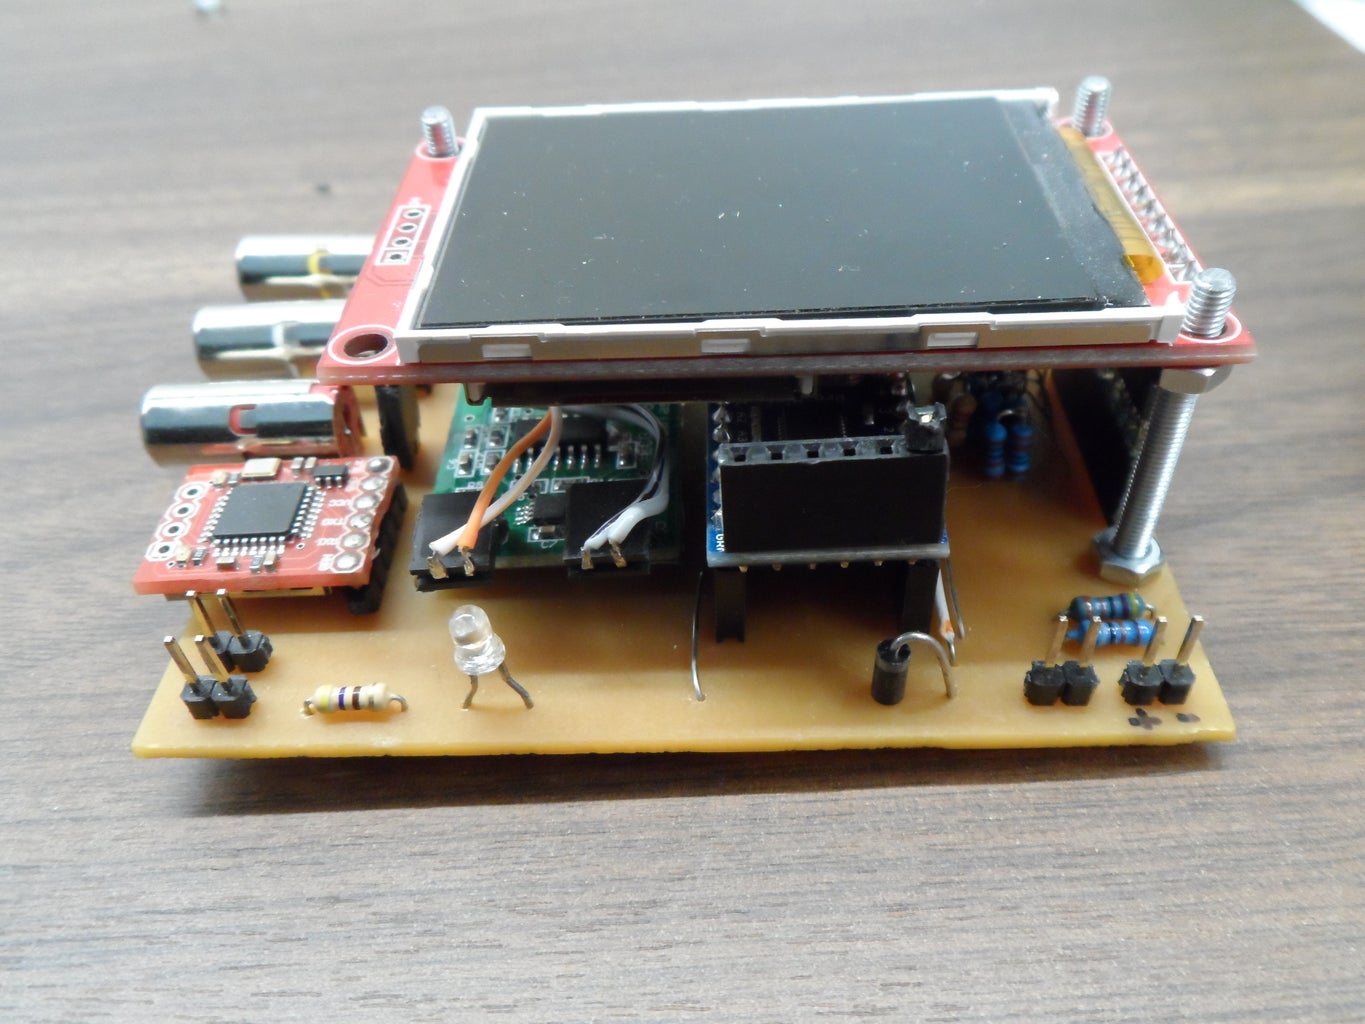
The assembly of the PCB was pretty straightforward. The design is pretty tight for space, but worked really well.
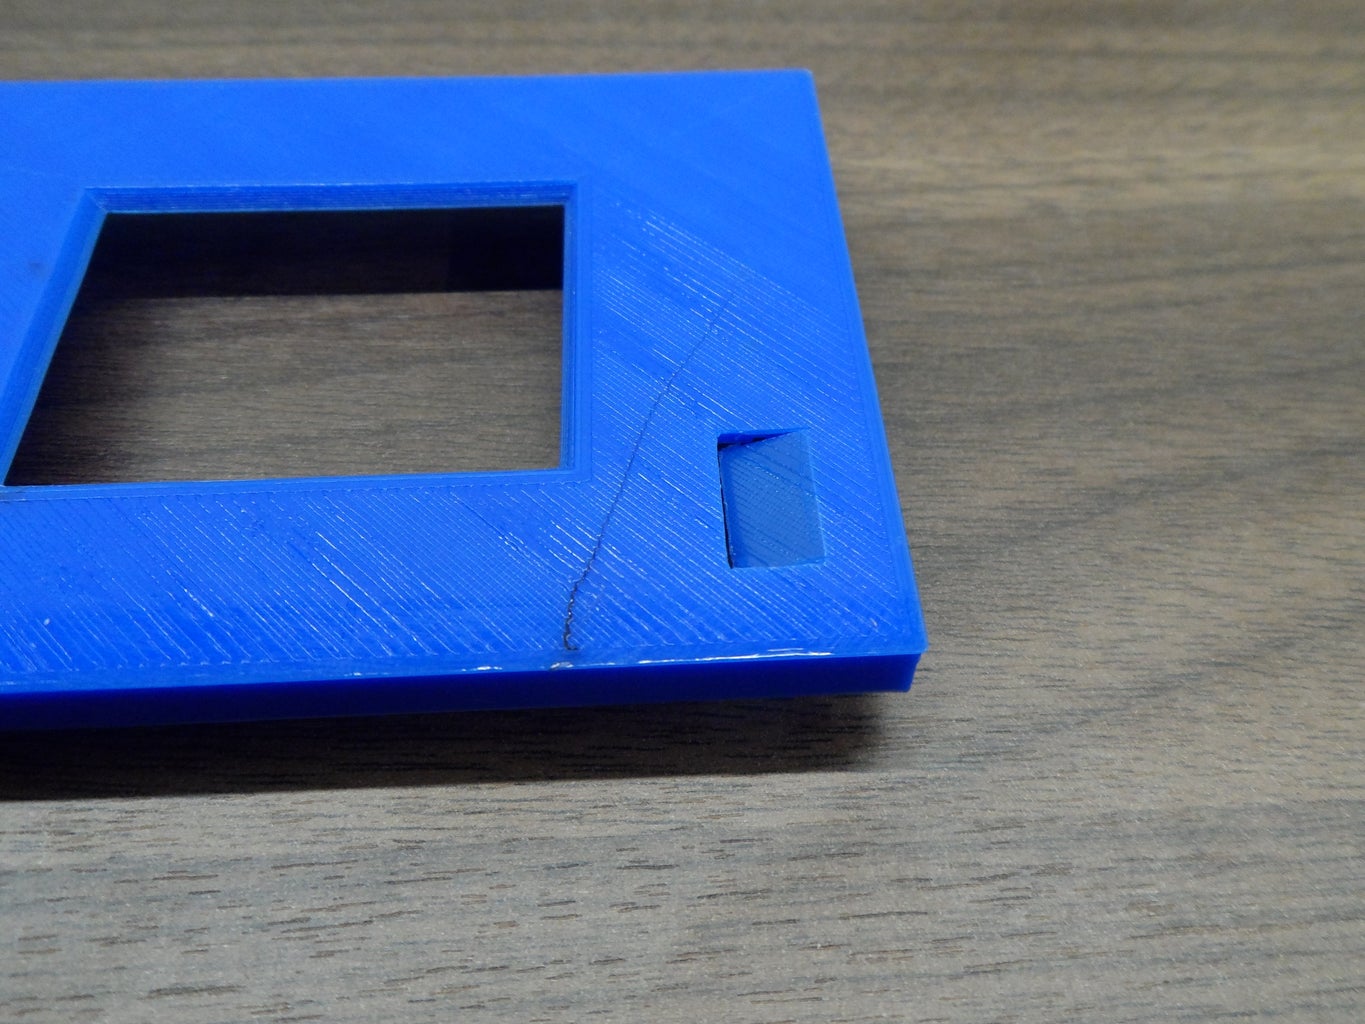
Step 5: 3D Printed Case


The free version of SketchUp was used for designing the 3D Printed parts, and then exported as STLs.
There were three parts, a lid, the main box and a belt hanger (which has not yet been fitted).
One very pleasing aspect was the inclusion of a 'knock-out' area for fitting the main power switch. This was printed with a thickness of 1mm and was easy to cut out with a knife (but was invisible without a backlight before it was cut out and hence, could have been left unused without spoiling the lid).
Also, a centre-line and 'pilot mark' was included for the fitting of the push button switches.
All these aspects are easy to add to the 3D model, and save lots of hassle when trying to cut and drill the case.


Step 6: Arduino Software/Sketch

The Arduino software grew in a rather iterative manner! It is not particularly pretty, but like every aspect of this project, I wanted a working solution as quickly as possible.
The software still includes debugging code, which is currently turned off with a 'debug' variable flag.
Once the software is running in datalogging mode, it simply reads the analogue voltage presented by the ECG front-end and sends it via serial link to OpenLog. In use, the values range between 50 and 700. I could have increased this range/resolution nearer to 1024 by adding an external voltage reference.
Timing
The most interesting aspect (?) is the timing element. Regular and reliable timing is tricky for a device like this due to different delays which get introduced by different parts of the program. As soon as the TFT is in use, the looping slows dramatically, so when collecting data with OpenLog, the TFT is not updated and it is blank. When datalogging, the finished ECG takes samples at a rate of better than 190 per second (around every 5 thousandths of a second), which is fine.
Timing must be regular, and a 'marker' of some sort was required so that the regularity could be measured and checked. This was achieved by using an interrupt handler which was triggered every second by the internal Timer1.
All the interrupt handler does, is set a 'flag' called InsertZero, it then lets the software carry on. In the main loop, the flag is tested and a zero is sent to the datalogger when the flag is set. As the miniumum value of the real heart data is about 50, the zero value is easily picked out as a '1 second marker'.
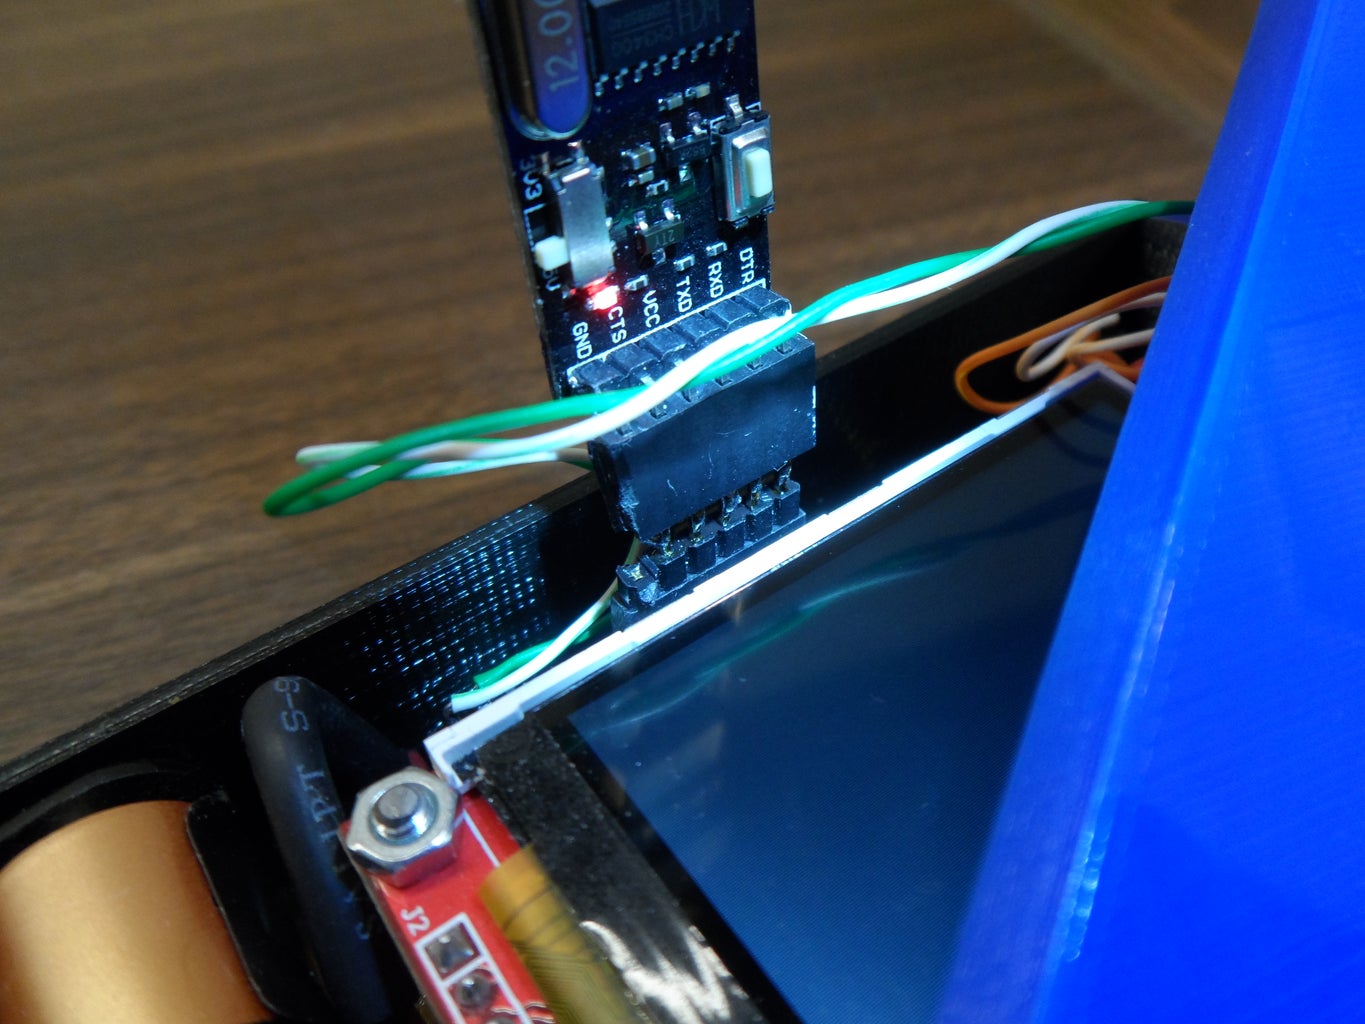
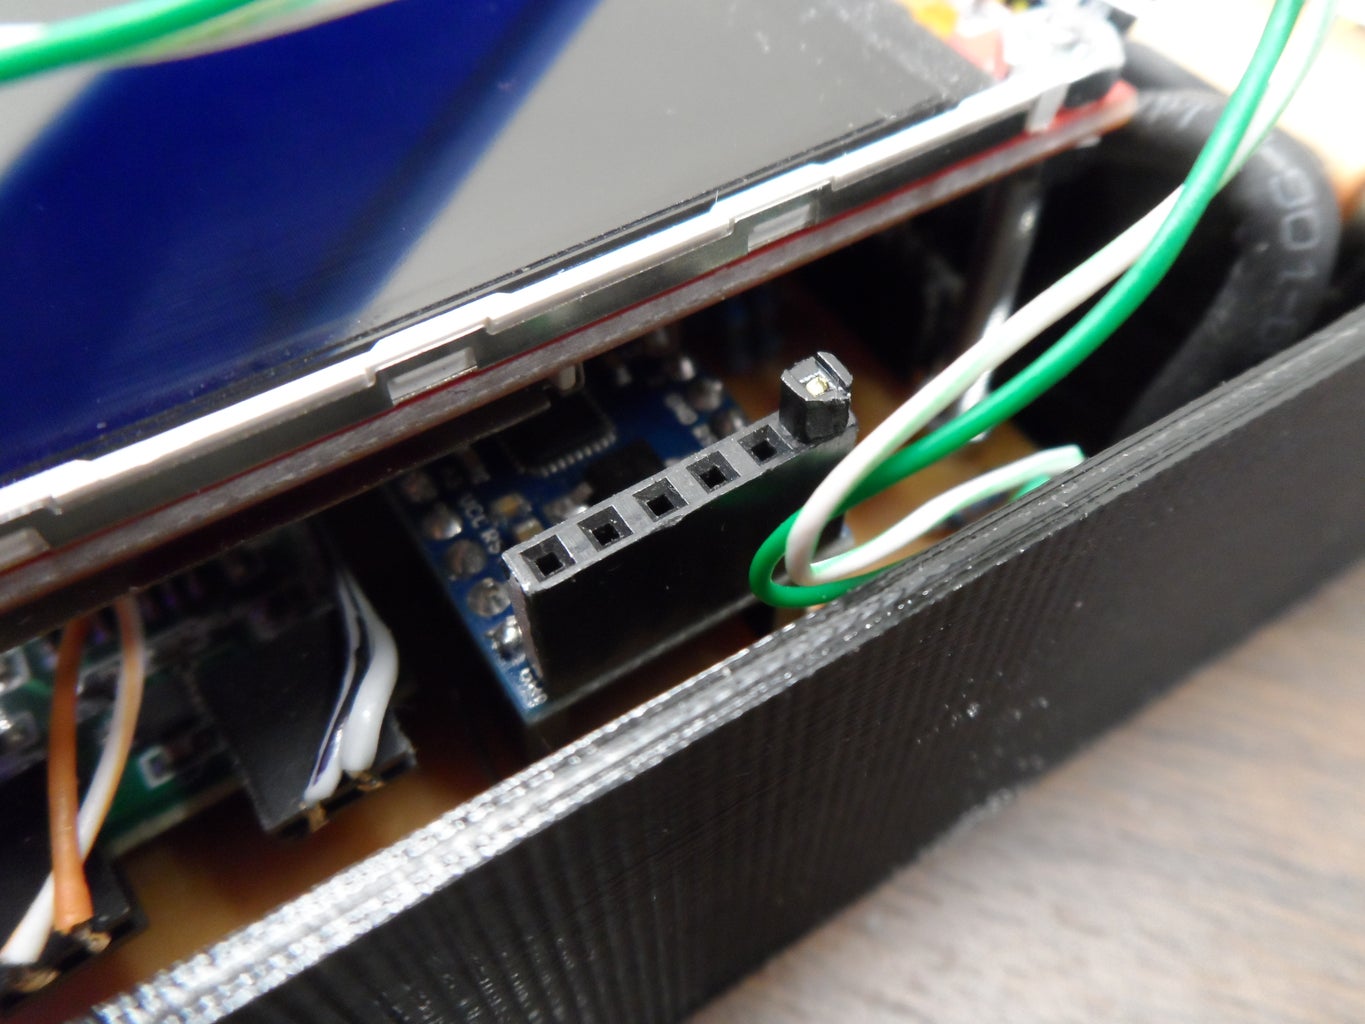
Programming interface
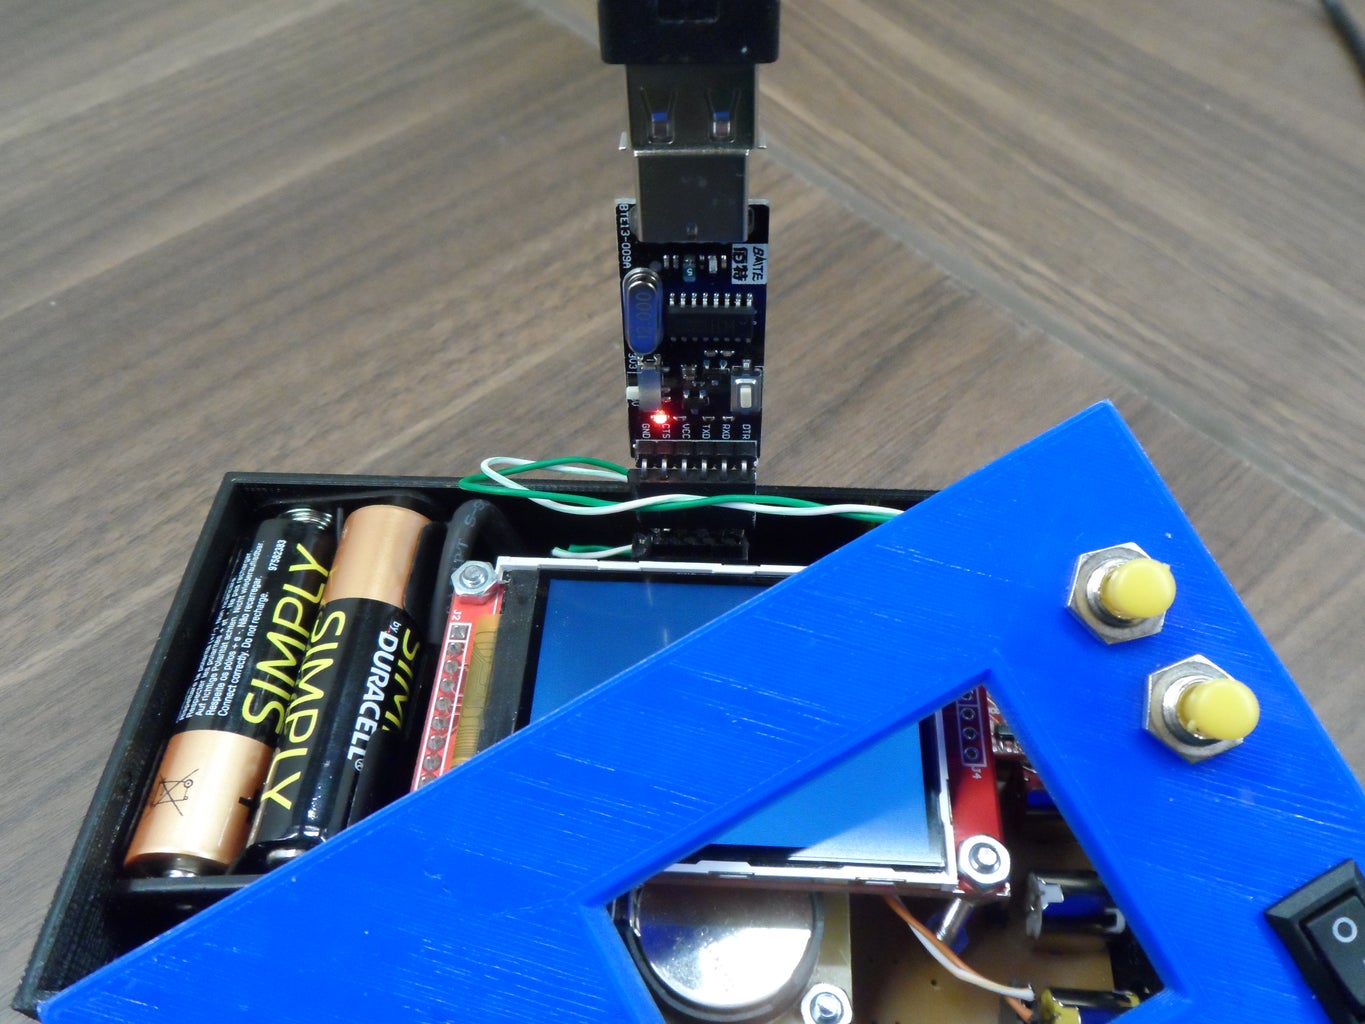
Having been 'bitten' before, right from the initial design, I made sure that the programming pins of the Arduino would be accessible once the project was assembled and running.
Attachments
Step 7: Displaying the Data

The data is displayed on the TFT screen, but to get something on paper requires some analysis.
The data is saved by OpenLog in CSV format and can load straight into Excel (etc) and inserting a 'scattergraph' shows the data with virtually no effort. The Excel image shows this. The data is upside-down compared to a 'normal' ECG. The one-second markers can clearly be seen. This has lots of drawbacks - mainly getting it to look anything like a real ECG is very tricky, and getting more than a few seconds of data displayed is very awkward.
Microsoft Small Basic Analysis
Embarrassingly, Microsoft's Small Basic is my go-to tool for quick-and-dirty data analysis! The output shown in the image is about 150 lines of trivial Basic code. It is so easy to draw the grid, open the data file, read the data, invert the data, plot the data in four rows, add labels, add a 1 second marker, etc. All with instant running, no waiting for compiling - it's an absolute breeze, and so powerful! The Small Basic Program is included here - it will need Small Basic to be installed on your PC and reads the data from a CSV file (called DataToPlot.CSV) which must be in the same folder as the Small Basic program. A few seconds of example data are included here (they show a fast and irregular heartbeat!)..
Step 8: Putting It All Together

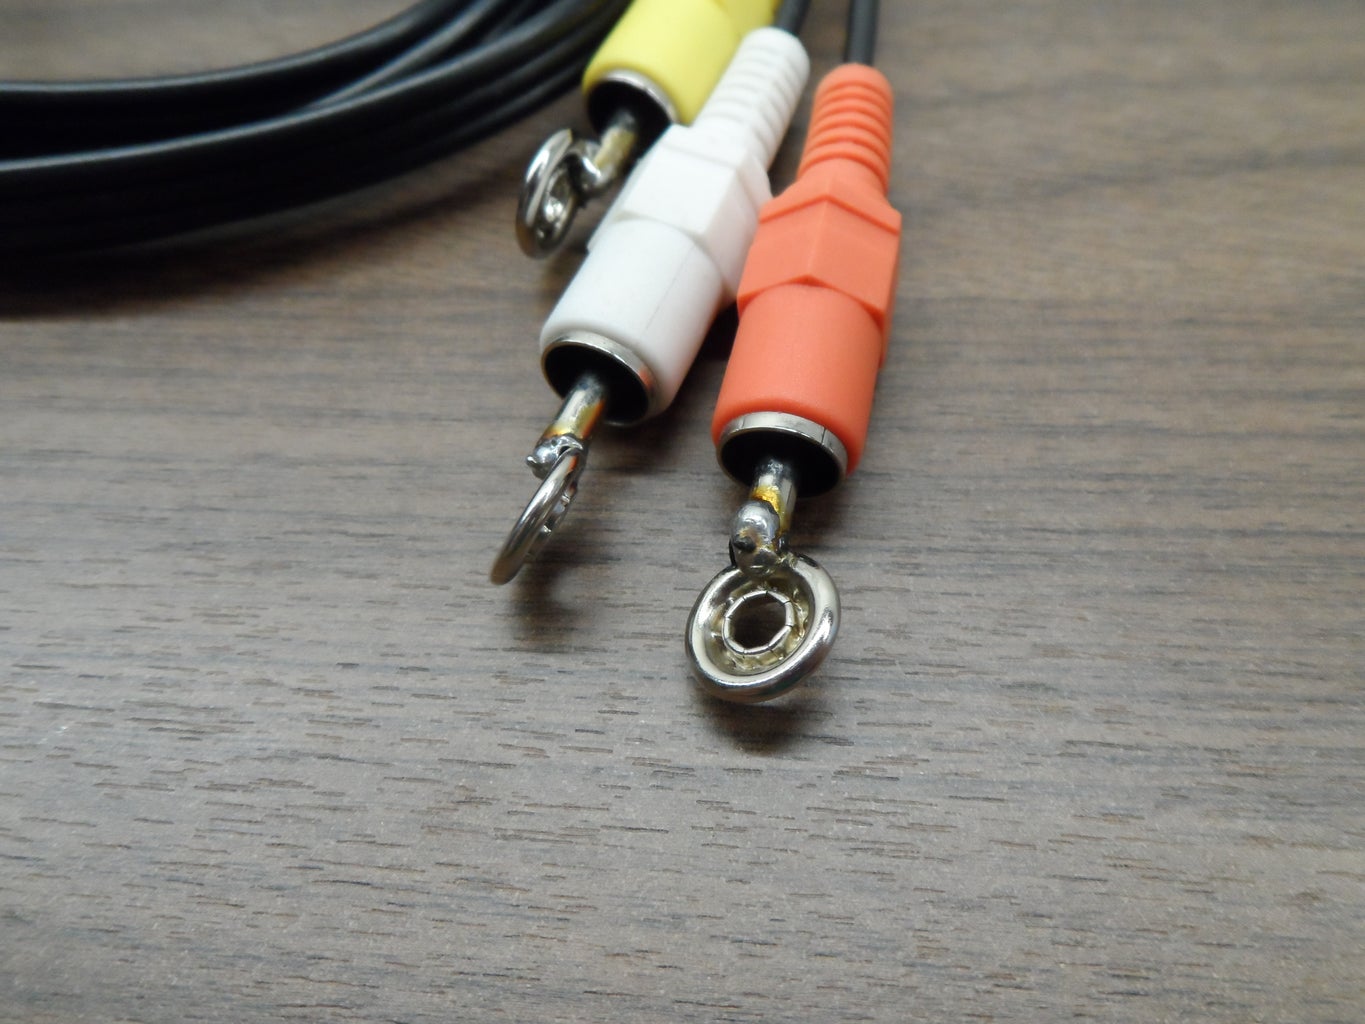


Connecting Lead
An old audio lead is used for the connections. Only two of the leads are actually used - the white lead was intended to be an 'earth' connection on a wrist or leg, but it never seemed to function, so it is not used.
Lead positioning
The diagram shows the positioning of the leads. The relevant ones for a two-lead set-up are labelled RA and LL. (The diagram is for a 3-lead set-up but RA and LL are right for the arrangement used in this Instructable - diagram from https://www.heartelearning.org/labyrinths?id=47895... )
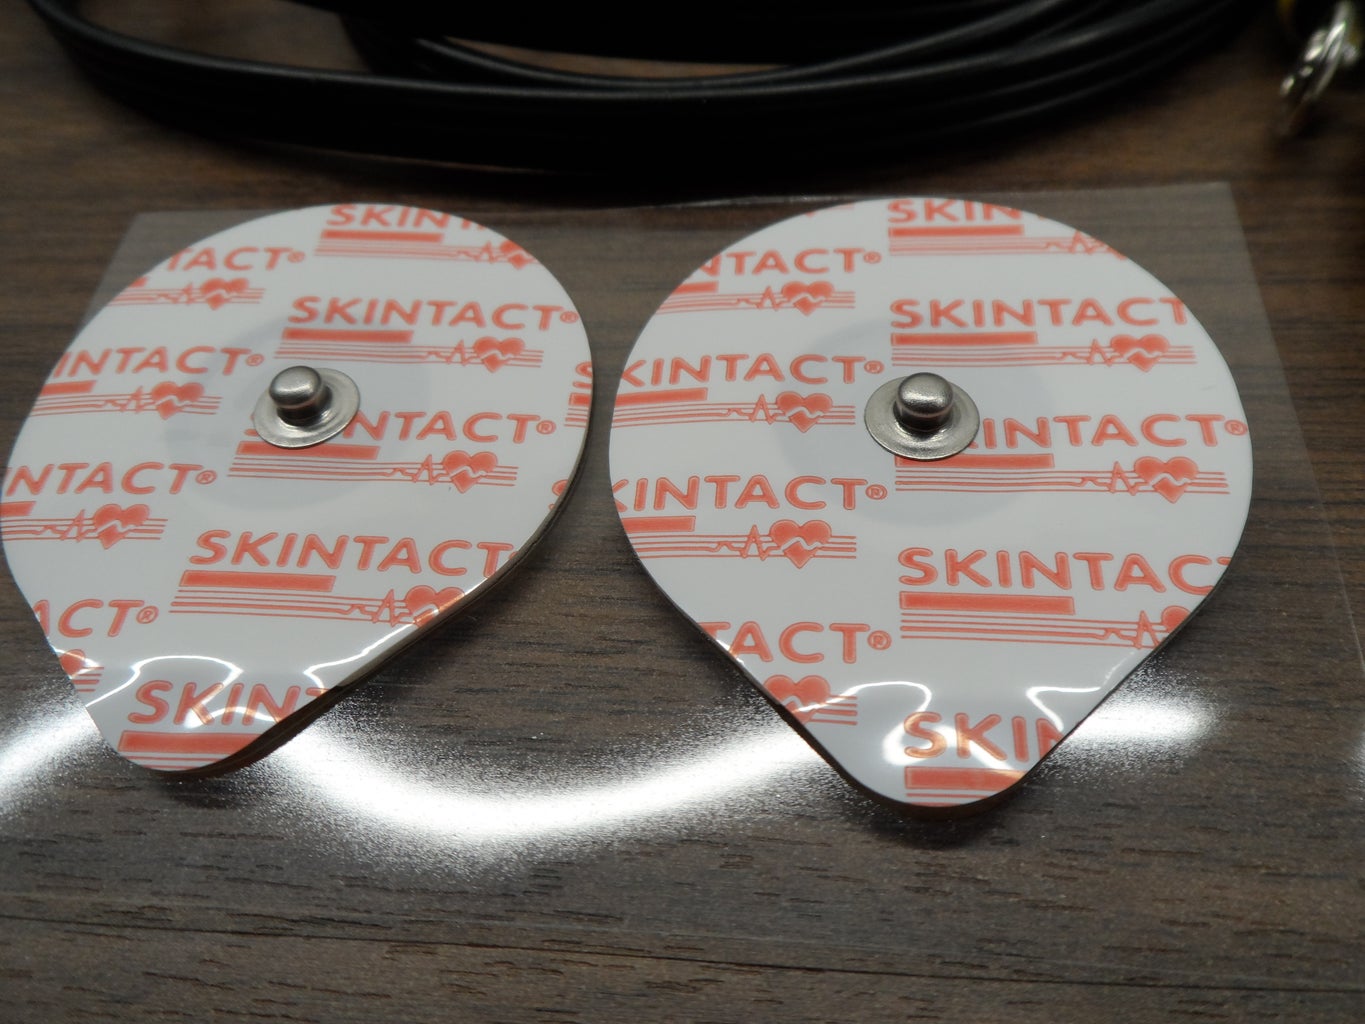
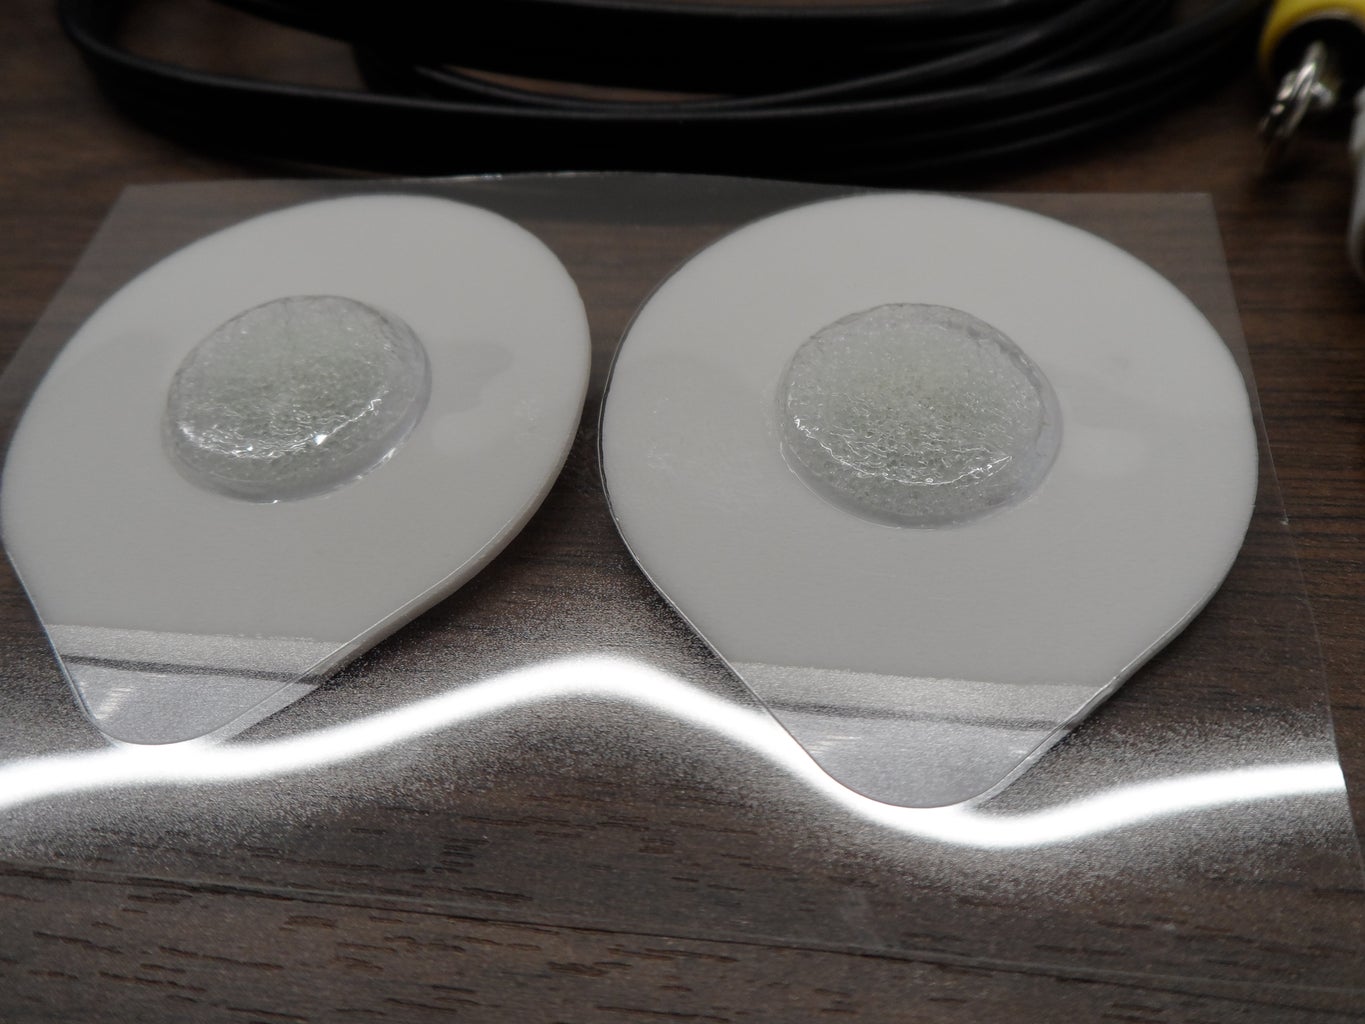
Electrodes
The electrodes are easy and cheap to purchase. They have a wet sponge in the middle. The ones pictured are single-use "Ag/AgCl electrodes".
Electrical Noise
The voltages the device measures are tiny. Being a battery-powered device avoids lots of electrical noise. It is sensible to keep away from equipment which radiates lots of electrical noise.
Battery Life
The device takes about 60mA when running. This is reduced when datalogging. No real attempt has been made to reduce consumption - it is only used in short bursts. The Duracell data sheet suggests that the AA cells should last around 40 hours at this discharge rate.
The Real Time Clock has a 2032 cell on board. This is still going strong after being around for a few years without much use (I believe it trickle charges when the board is connected up?).
In Use
The electrodes are stuck onto the chest. The leads clip onto the electrodes and plug into the ECG.
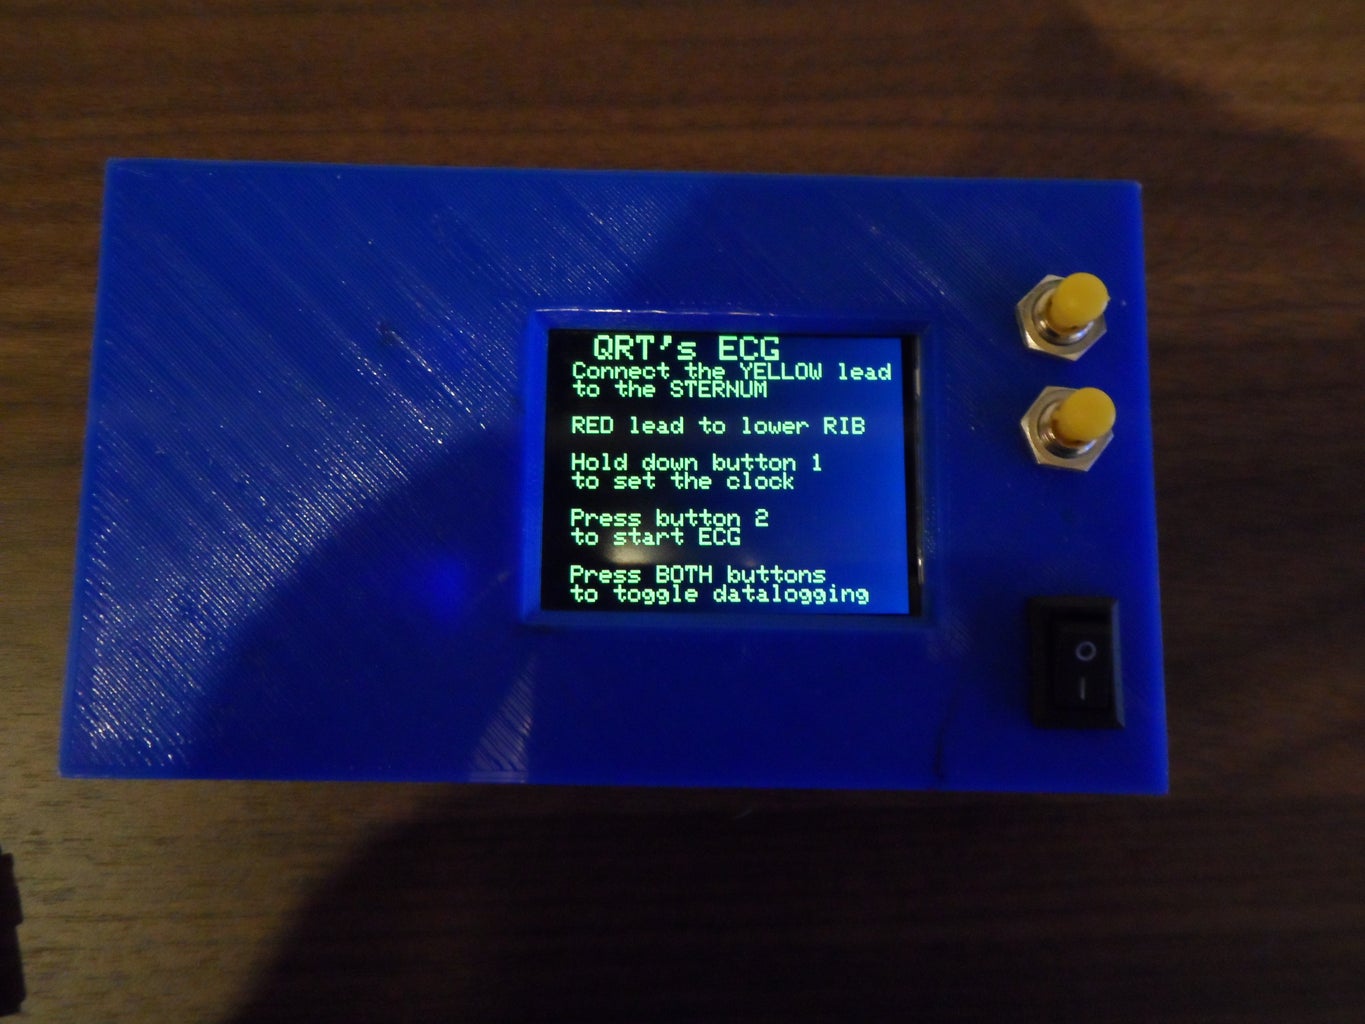
When switched on, a reminder screen is shown. The Real Time clock only needs setting once in a blue moon. If one button is held down - the software switches to a 'clock setting' mode, where each time element (year, month, day, hour, etc) is set by a button push.
If the alternate button is pressed, the TFT displays the heart beat ECG trace. This enables the user to check that the trace looks OK, and generally be happy that it is working. At this point, pressing the two buttons simultaneously triggers the datalogging to begin - and the TFT goes blank. Pressing the two buttons again, will stop the datalogging and restore the TFT trace.
Trying this yourself
I repeat, that many elements of this project could be improved. I really just needed a tool to do a job, and I stopped fiddling as soon as the bit I was working on actually worked.
That said, this seems to be a really good prototype, with a truly useful function. It is ripe for improvement - hence this Instructable.
Note the disclaimer on the first page!


