

Introduction: Google Maps for Education
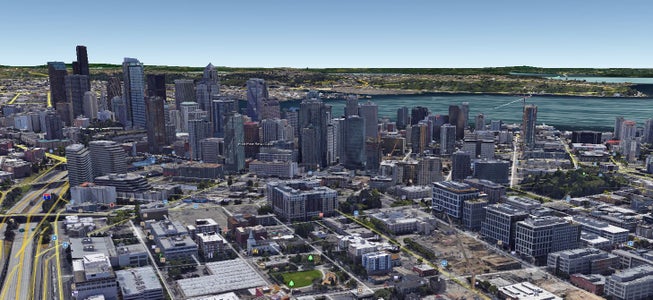


Google Maps (or any maps) can be an incredibly powerful and unfortunately an incredibly confusing tool for educators. One one hand, most printed maps are simple but do not show all of the details for a particular assignment. On the other hand, most digital maps are complex and can be difficult to learn how to use and yet they offer so many interactive opportunities for learning! The above pictures are both sets of data included with Google Map data (3D buildings and terrain and traffic layers)! At times though, it can be very frustrating for educators trying to understand all the ins and outs of digital maps, even friendly ones like Google Maps. Even after those details are understood, it still takes considerable time to build maps resources for students to use. The following is a primer on how to utilize some of the amazing features of Google Maps in an educational setting and truly make geography come to life through free data and software!
The following should help educators and can also be easily used by parents to help engage children more in depth with geography and cartography.
Step 1: How Google Maps Work (Skip This If You Already Know)


To access Google Maps public map data, simply visit the website at https://maps.google.com. This will give you several data sets all overlaid on one view. An important concept for Google Maps is that all of the data you see is done in ‘layers.’ A layer is one set of data laid on top of the map. The first layer is called the base map and can be set to either ‘Map’ (which just includes the streets on a white background) or ‘Earth / Satellite’ which overlays the satellite imagery and available 3D features on the map. Please note that not all browsers support the 3D data sets, so you may just see the satellite layer. In some browsers, the Earth / Satellite layer appears as a selection in the bottom left corner instead of under the hamburger menu.
There are several other layers given by default you can toggle on or off. The traffic layer is one my favorites as it shows real time traffic data right on top of the base layer! Check out the toolbar on the left and click the hamburger menu to view all of the default layers Google gives you on their public facing maps page. There is the aforementioned traffic layer, a layer for bike routes, a layer for public transit and more!
The Google Maps interface is actually very friendly. To move around the map simply click and hold to pan side to side or up and down. To zoom in or out, use the scroll wheel or the scroll feature on your touch pad. If you are on a touch device, zooming is typically handled when you form the 'pinch' motion with two fingers (reverse that motion to zoom out). You can also click the navigation buttons in the bottom right hand corner. As you pan or zoom that map, you will notice the data reloads to match where you have navigated. P.S. I have highlighted the features discussed in the images. Just mouse over the boxes!
Step 2: Creating Your Own Map


So what if you want to build your own map with your own custom layers? Well...Google gives you the power to do that as well! Once you are logged in to your Google account, simply visit mymaps.google.com. This provides an interface for you to build your own map and add your own layers and save that map to your Google Drive automatically.
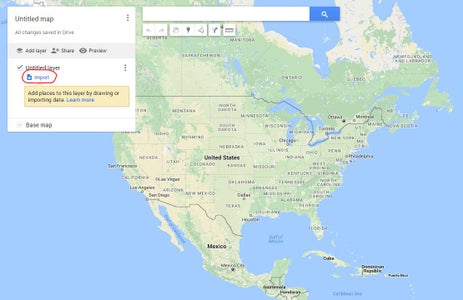
To build a new map, click the red button near the top left that says ‘Create A New Map’. This will create the basic map for you with some options for base layers. Before you start adding data, be sure to click on the title of your map (default is 'Untitled Map') and give it a helpful name! To toggle the different base layers, simply select the down arrow next to ‘Base map’ near the bottom of your toolbar on the left hand side and click! After selecting your base layer, you can start adding your own layers on top of it! To add a layer, click the ‘Add layer’ button.
Now this is where it gets a little tricky. What exactly should you put in a layer? How do you put those things in a layer? You can think of a layer as one set of data. That is, everything in a layer typically belongs to the same data set. If you are mapping all the elementary schools in your district, all those makers could go in the same layer. Keep in mind that layers can be turned off or on together. That means if you want to hide the layer, everything in that layer will be hidden. This allows you to quickly group and visually display various data sets. Google gives you a couple different types of things you can put in a layer. There is a marker...which just highlights a particular point. You can also draw a line or create a shape (polygon).
There are two basic ways to add things to a layer in Google Maps. The first way is by adding your own items by hand using the web interface. You will notice under the search bar near the top of your base map, there are a few buttons. There should be a button to add a marker and another to add a line. You can click those buttons and start placing things on your map! Using the line tool, you can close the line and create a shape as well (a polygon). You will notice those things get placed in the layer you have selected on the left. You can click each item and give it a name and a description and you can change the styles (colors etc). P.S. I have highlighted the features discussed in the images. Just mouse over the boxes!
Step 3: Importing Existing Map Data
In the previous step, I mentioned there were two basic ways to include your own data in a Google Map. Aside from adding the data by hand, you can also import existing data created by someone else! There is already a lot of maps data created and there is no reason you should have to reinvent the wheel! For example, what if you want the border of your state outlined? There are already polygons drawn for all the states and counties in the United States(and many many other things)! You do not have to redraw the polygons around your entire state border. If you live in Colorado this is easy since you just have to draw a rectangle but if you live in Maryland...not so much!
So where can you find all the existing data and how do you get it into your map? Most of it is stored in what Google calls Fusion Tables. A Fusion Table is just a table with a standard format that is easily stored and parsed. A lot of maps data is stored in such a table and you can find it pretty easily. Here is the fusion table maps data for all the US state borders and here is the county borders map data. If you visit those links you can see the outlines on the map, and you can get the actual coordinates for all the points in the outline. Simply click on your state or county and a dialog window should appear with a few things, including a shape labeled ‘geometry’. These coordinates listed under ‘geometry’ are all the latitudes and longitudes of each point that form the outer border of the shape you have selected.
So how do you get that geometry on your map? The simplest way for now is to copy and paste those coordinates into a valid kml file. A kml file is a type of file that maps can understand...it stands for Keyhole Markup Language. Keyhole, Inc. was the name of the company that started what is now Google Earth and they devised the kml format so that it could be read by all of their map products. Attached to this step is an example kml file that has the border of Maryland...just replace the geometry in this file with your geometry numbers and you will have a kml file with your borders!
Once you have your kml file, save it and upload it to your map. To upload it to your map, add a new layer and click the link to import data. From there, select the kml file off your computer and Voila! Your own layers imported! From here the world is literally yours to map and teach. By the end of your lesson you will have a classroom full of cartographers! P.S. I have highlighted the features discussed in the images. Just mouse over the boxes!
Attachments

Step 4: Publishing and Sharing Your Map


So you have created this awesome map to use and share with your students, children etc. How do you share it? On your toolbar on the left hand side you should see a button next to the 'Add Layer' button that says 'Share'. Click this will give you the options you need to share the map. You can share it with an individual person by adding their email to the list. You can also copy and paste the share link at the top of the dialog and give it to whomever you wish. You can also make your map public by clicking the link 'Change...' under the first entry in 'Who Has Access'. As with the previous steps, I have highlighted the features discussed in the images. Just mouse over the boxes!
There are a couple of things to be aware of when it comes to sharing your map. You can share your map with different permissions levels. First, you can share your map and allow someone to edit it. This means they will be able to add and remove things from the map. If you are an educator and plan on sharing your map with your students, you likely do not want them to have the ability to edit it. If that is the case, make sure you select 'Can View' as the access level and not 'Can Edit'. 'Can View' should also be the default if you make your map public. If you click the button next to the share button (Preview) you will see what your viewable (but not editable) map will look like.
One more trick to note with sharing. If you are using Google Classroom at your school you likely have a separate domain you use to login (@yourdomain instead of @google.com). There might be security restrictions for student accounts that prevent students from receiving any shared information that is NOT from their domain. If that is the case, please make sure to create the map from an account that uses the same domain!
Now you have created and built a custom Google Map! You have shared it with your students or children and are ready to teach using interactive technology! Happy mapping!


