

Introduction: Plot DHT11 Data Using Raspberry Pi and Arduino UNO


This instructable explains how I plot temperature sensor DHT11 data using Arduino Uno and Raspberry Pi. In this temperature sensor is connected with Arduino Uno and Arduino Uno is connected serially with Raspberry Pi. At Raspberry Pi Side, matplotlib,numpy and drawnow libraries are used to plot graphs.
Step 1: Things Needed for the Project


1. Raspberry Pi
2. Arduino Uno
3. DHT11 Temperature Sensor
4. Jumper Wires
5. Breadboard
Step 2: Download and Install Arduino IDE in Raspberry Pi


Note :- You can use Arduino IDE of windows,Linux or Mac to upload sketch in Arduino UNO.
First step is to install Arduino IDE for that open browser in Raspberry Pi and open the link given below
Then download the Linux ARM version and extract it using command
tar -xf file name
After extracting you will see a new directory. Here I am using arduino-1.8.2 IDE. Then go to directory by using command.
cd arduino-1.8.1
To run Arduino IDE, use this command in arduino-1.8.2 directory
./arduino
How to use libraries
To install any libraries in Arduino , simply download the library and paste in arduino 1.8.2 ==> libraries folder .
NOTE:- Make sure there is no ( - ) in library folder for ex (DHT-sensor). If there is any (-),rename it .
we will use two libraries in this instructable, DHT_Sensor and Adafruit_Sensor

Step 3: Code for Arduino

Now, lets get python and Arduino talking together. Firstly we need a simple program to get the Arduino sending data over the serial port. The following program is a simple program that will have the Arduino count and send the data to the serial port.
Arduino Code
#include "DHT.h"
 float tempC;  // Variable or holding temp in C float tempF;  // Variable for holding temp in F float humidity; //Variable for holding pressure reading
#define DHTPIN 7 // what digital pin we're connected to
#define DHTTYPE DHT11 // DHT 11
//#define DHTTYPE DHT22 // DHT 22 (AM2302), AM2321
//#define DHTTYPE DHT21 // DHT 21 (AM2301)
// Initialize DHT sensor.
DHT dht(DHTPIN, DHTTYPE);
void setup(){
Serial.begin(115200); //turn on serial monitor
dht.begin(); //initialize dht }
void loop() {
tempC = dht.readTemperature(); //  Be sure to declare your variables
humidity = dht.readHumidity(); // Read Humidity
Serial.print(tempC);
Serial.print(" , ");Serial.print(humidity);
Serial.print("\n"); // for new line
delay(2000); //Pause between readings. }
Once sketch is compiled , select board and port and upload it.
Step 4: Setup Raspberry Pi

Once code is uploaded, Install some libraries so that we can plot graph of data which is coming serially from Arduino Uno.
1. PySerial is a library which provides support for serial connections over a variety of different devices. To install it use command.
Sudo apt-get install python-serial
2. Numpy is a package that defines a multi-dimensional array object and associated fast math functions that operate on it. It also provides simple routines for linear algebra and FFT (Fast Fourier Transform) and sophisticated random-number generation. You can install it in many ways either use apt package or pip. Here I am installing using pip for that first we have to install pip
sudo apt-get install python-pip python-dev build-essential
sudo pip install numpy
or if you wanna use apt package
sudo apt install python-numpy
3. Matplotlib is a 2D plotting library which provides an object-oriented API for embedding plots into applications using general-purpose GUI toolkits like Tkinter, wxPython, Qt, or GTK+. To install it use command
sudo pip install matplotlib
or
sudo apt install python-matplotlib
4. Drawnow is generally used to see the results after each iteration as we use "imshow" in MATLAB. To install it use command
sudo pip install drawnow
Step 5: Python Scipt

Next step is to write a python script for that you can use any editor to write it.
1. Plot data in one graph
import serial                      # import Serial Library

import numpy                    # Import numpy
import matplotlib.pyplot as plt #import matplotlib library
from drawnow import *
tempC = [] #Empty array<br>humidity = []
arduino = serial.Serial("/dev/ttyACM0", 115200)plt.ion() # interactive mode to plot live data<br>count = 0
def makeFig():              #Create a function that makes our desired plot
   plt.ylim(20,30)                              #Set y min and max values
plt.title('Real Time DHT11 Data') #Plot the titleplt.grid(True) #Turn the grid on
plt.ylabel('Temp C') #Set ylabelplt.plot(tempC,'b^-', label='Degree C') #plot the temperature
plt.legend(loc='upper right') #plot the legend
plt2=plt.twinx()                                #Create a second y axis

plt.ylim(50,70)                           #Set limits of second y axis
plt2.plot(humidity, 'g*-', label='Humidity') #plot pressure data

plt2.set_ylabel('Humidity')                    #label second y axis
plt2.ticklabel_format(useOffset=False) plt2.legend(loc='upper left')
while True: # While loop that loops forever
    while (arduino.inWaiting()==0): #Wait here until there is data
pass #do nothing
arduinoString = arduino.readline()
dataArray = arduinoString.split(',') #Split it into an arraytemp = float( dataArray[0])
hum = float( dataArray[1])
tempC.append(temp)
humidity.append(hum)
     drawnow(makeFig)

     plt.pause(.000001)
count=count+1<br>
if(count>20): #only take last 20 data if data is more it will pop first tempC.pop(0)
humidity.pop(0)
2. To plot humidity and temperature separately
import serial # import Serial Library
import numpy  # Import numpy
import matplotlib.pyplot as plt #import matplotlib library
from drawnow import *
tempC = [] #Empty array
humidity = []
arduino = serial.Serial("/dev/ttyACM0", 115200) #Serial port to which arduino is connected and Baudrateplt.ion() #Tell matplotlib you want interactive mode to plot live data
def CreatePlot(): #Create a function that makes our desired plot
    plt.subplot(2,1,1)  #Height,Width,First plot
plt.ylim(22,34) #Set y min and max values
plt.title('Real Time DHT11 Data') #Plot the title
plt.grid(True) #Turn the grid on
plt.ylabel('Temp C') #Set ylabels
plt.plot(tempC,'b^-', label='Degree C') #plot the temperature
plt.legend(loc='upper center') #plot the legend
    plt.subplot(2,1,2)  # Height,Width,Second plot

    plt.grid(True)
plt.ylim(45,70) #Set limits of second y axis
plt.plot(humidity, 'g*-', label='Humidity (g/m^3)') #plot humidity data
plt.ylabel('Humidity (g/m^3)') #label second y axis
plt.ticklabel_format(useOffset=False) #to stop autoscale y axis
plt.legend(loc='upper center')
while True: # While loop that loops forever
    while (arduino.inWaiting()==0): #Wait here until there is data
        pass #do nothing
arduinoString = arduino.readline() #read the data from serial port
   dataArray = arduinoString.split(',')   #Split it into an array

    temp = float( dataArray[0])            #Convert first element to floating number and put in temp
hum = float( dataArray[1]) #Convert second element to floating number and put in hum
tempC.append(temp) #Build our tempC array by appending temp reading
humidity.append(hum) #Building our humidity array by appending hum reading
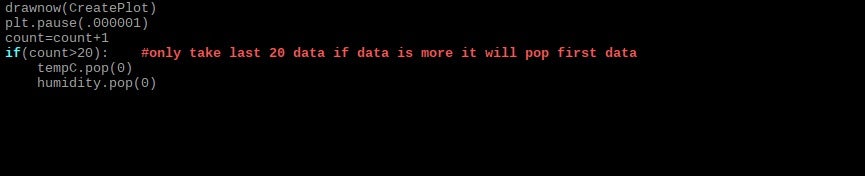
drawnow(CreatePlot)
plt.pause(.000001)
count=count+1
   if(count>20):    #only take last 20 data if data is more it will pop first
        tempC.pop(0) # pop out first element
humidity.pop(0)
Step 6: Circuit Diagram


Arduino ==> DHT11
3.3V ==> VCC
GND ==> GND
D7 ==> OUT
Step 7: Result

Participated in the
Electronics Tips & Tricks Challenge


