

Introduction: Raspberry Pi Analogue to Digital A/D Conversion Board and GUI Voltage Display


This instructable is about the construction and operation of a 16/18 BIT 4 channel “differential” A/D board. It’s based on the MCP3428/MCP3424 and communicates to the Raspberry PI via I2C. The design was chosen to allow either one board or a number to be joined together, and the address for each chip can be chosen to one of 8 different combinations so in theory you could connect 8 together. I have included on the PCB a logic level converter based on two BSS138N N CHANNEL MOSFET’s, but also there are pins on the PCB for 5 volt I2C so the board could be connected to an Arduino etc. Also the board could be powered at a lower supply voltage as the MCP3428/MCP3424 can operate from as little as 2.7volts.
There are basically 3 parts to this instructable.
Part 1 is the manufacturing of the board and connecting to the Raspberry pi.
Part 2 is how to set up the raspberry pi to use I2C
Part 3 is the GUI using Tkinter, datalogging using Sqlite3 and Plotting a graph using MatPlotLib.
Step 1: Soldering Surface Mount Components


I am not going into the constructions of the PCB as I will be covering that in a different Instructable, so all I am going to explain is the component placement and soldering surface mount chips.
You should be able to see in the photos that I have used all surface mount components on one side of the board and on the other side I have put the pins to allow for all the connections.
Soldering surface mount components by hand is possible by the average (capable in soldering) person. However to give yourself the best chance you should only use 0.5mm solder and the finest tip you can get for your soldering iron.
DON’T RUSH. What I like to do is pre solder a pad on each PCB component and it’s worth noting that I use lead/tin solder with a good bit of resin. Only the slightest amount of solder is required and don’t hang around as you could overheat a pad and lift it from the PCB.
With the PCB held in a small vice, very carefully place the component onto its pad, check the alignment and if you are happy hold the component in place with a toothpick then re-melt the solder. Check the alignment again and solder the opposite pin. Check the alignment again and if all is ok then solder the rest of the pins. For a chip what I do is solder a couple of pins then place my finger on the chip to dissipate the heat. If you solder all the pins in one go then you may cook the chip. Then using an eyeglass check the soldering has correctly taken to each pin and rework any that look dry. If you have got a short between pins then a quick swipe with the soldering iron (away from the pins) should clear it, or use a solder sucker.
Step 2: Connecting to Raspberry PI


Connections to the raspberry pi should always be made with the pi turned off and the power removed.
Connecting the PCB to the Pi only requires 5 wires.
White wire is 3.3v from the Pi to supply the logic level converter
Blue wire is I2C from chip to PI at 3.3v levels (Clock)
Yellow wire is I2C from chip to PI at 3.3v levels (Data)
Red wire is 5volts from the pi which feeds the A/D chip
Black wire is ground.
The analogue inputs are connected in pairs in order onto the 8 pin header, Max 2 volts +- (chip reference voltage)
If you need to input a voltage higher than the reference then you will need to drop the voltage over a potential divider network.
Step 3: Configuring the Raspberry PI for I2C


To get I2C to work on your raspberry pi you need to do a few things. Firstly you need to enable it in the config file.
Open terminal and type:-
"Sudo raspi-config"
This will open the config GUI
Select option 8 (Advanced Options) using tab then press enter
Select option A7 (I2C) using tab then press enter
"Would you like the ARM I2C interface to be enabled?"
select yes using the tab then press enter
"The ARM I2C interface will be enabled after a reboot"
press enter to "Ok"
"Would you like the I2C kernel module to be loaded by default?"
press enter to select "Yes"
"I2C kernel module will now be loaded by default"
press enter to "Ok"
tab to finish and press enter
"Would you like to reboot now?"
Press enter to select "Yes"
Step 4: Required Modules


once rebooted you need to edit the modules file, so open terminal and type.
"sudo nano /etc/modules"
add the two lines at the bottom then "Ctrl X" and "Y" (yes) and enter
Then to use I2C you will need to get smbus and I2C tools.
Open Terminal and type:-
"sudo apt-get install –y python-smbus i2c-tools"
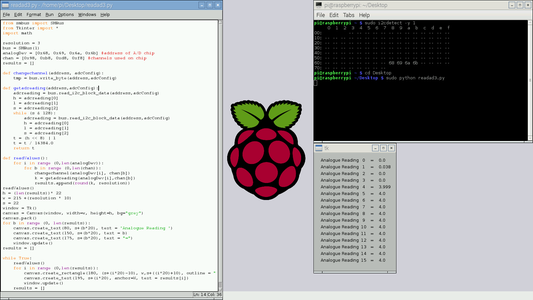
Checking connection.
Once all connections are in place, and the required commands completed .power up the raspberry pi and then open terminal and type
"sudo i2cdetect -y 1"
this will show you all the devices connected to the I2C bus, you can then copy over the addresses to the Devs list as shown in the photos
Step 5: Python Program and TKinter GUI
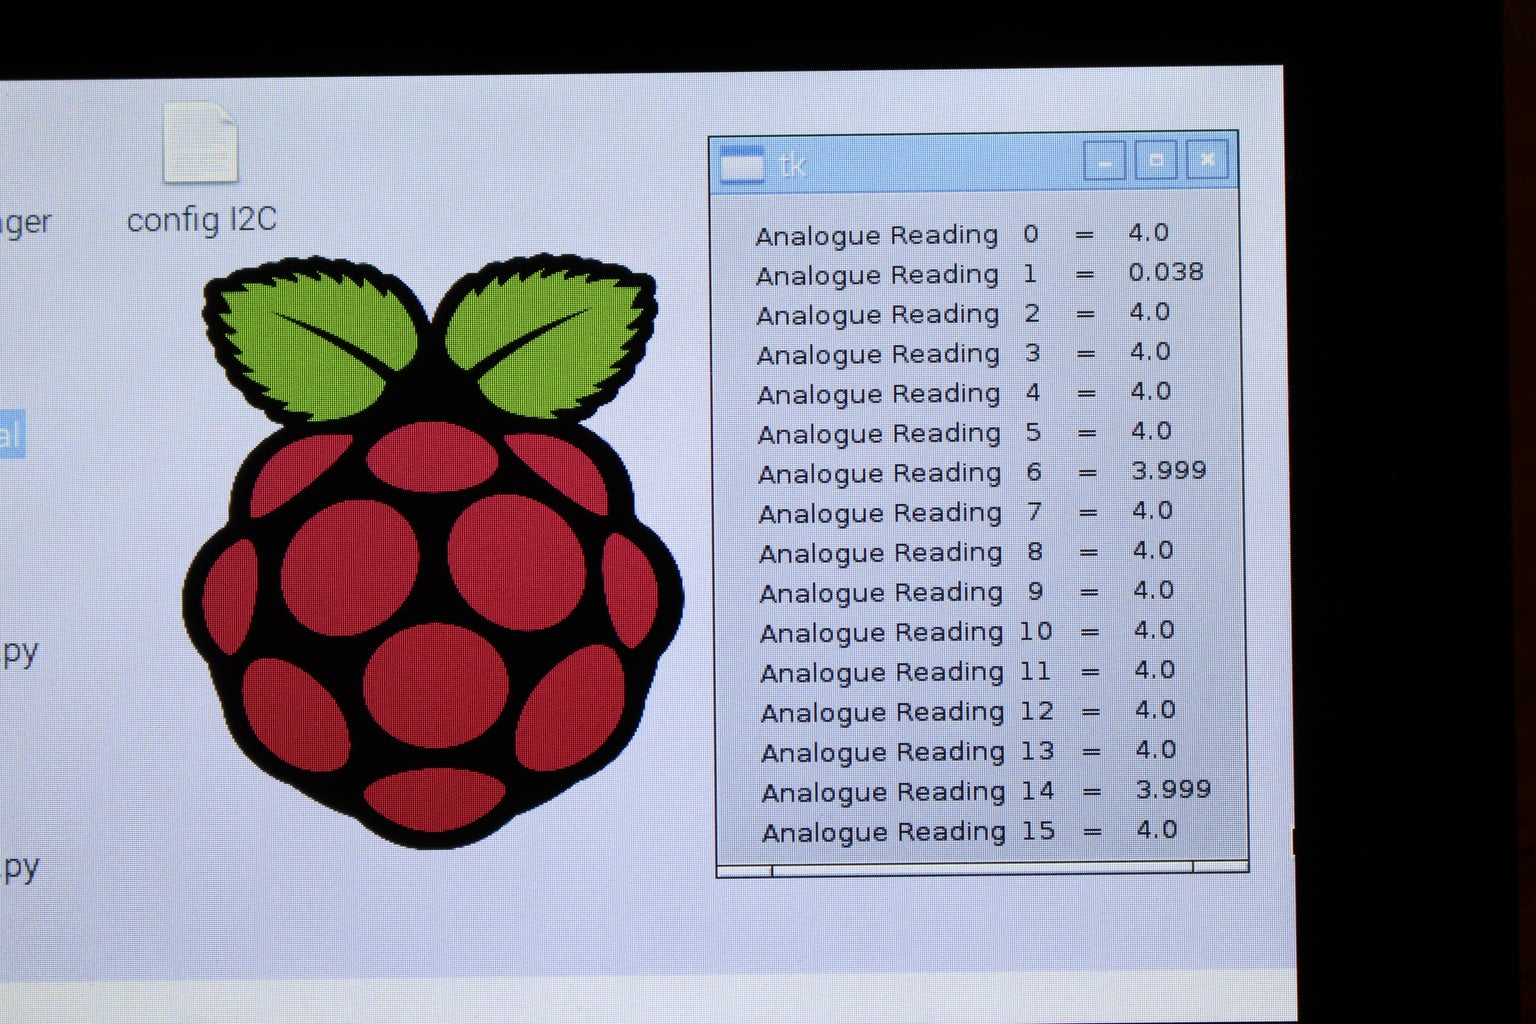

The GUI is my first attempt at playing with TKinter. What I have done is firstly take all the readings of the devices listed in the Devs, and stored all the values in an array. Then I make a window based on the number of items in the list for the height and the resolution determines the width. So if you only have two chips or you only want 1 decimal place then the window will automatically resize to show the required data.
When I first did this program I realised the updated text was being written on top of the old text, so to fix this I drew a grey filled rectangle over the old text before I write the new text and this seems to work well. I am not sure if there is a better way to do this updating of text but what I have done works well!
The channel numbers have to be chosen to select the correct channel 1-4, the required resolution and gain. And Bit 4 (Conversion Mode Bit) set to 1 to allow Continuous conversions and avoid having to write to Bit 7 to initiate a conversion.
In my example I have kept it simple by using the same gain and resolution for each measurement. If I wanted to change this then I would also need to change the divider as well to get a real voltage value.
Step 6: Sqlite3 Making a Database.


When I had managed to get this program working I then had a look at storing the readings and drawing a graph. The first part was easy. Firstly you need to download Sqlite3 and whilst you are at it also fetch MatPlotLib
open terminal and type:-
sudo apt-get install python-matplotlib
sudo apt-get install sqlitebrowser
sudo apt-get install sqlite3
Secondly you will need to write a small program to make the new database and tell it what will be included in the table.
when you have written the program open terminal and navigate to folder where the program has been stored and then type
"sudo python makeDB.py" (or what ever you called the program)
If you now type "ls" you should see in the list the new database.
Next the original read AD program needs to be modified to add the data into the database. Again this is not hard as all the data was stored in a single file.
import sqlite3
conn = sqlite3.connect('database03.db')
c = conn.cursor()
keyword1 = "ch01"
keyword2 = "ch02"
keyword3 = "ch03"
keyword4 = "ch04"
results = []
def dataEntry():
c.execute("INSERT INTO adresult1(ID, datestamp, keyword1, ch1, ch2, ch3, ch4) VALUES (?,?,?,?,?,?,?)"\
,(jk,date,keyword1,results[0],results[1],results[2],results[3]))
c.execute("INSERT INTO adresult2(ID, datestamp, keyword2, ch1, ch2, ch3, ch4) VALUES (?,?,?,?,?,?,?)"\
,(jk,date,keyword1,results[4],results[5],results[6],results[7]))
c.execute("INSERT INTO adresult3(ID, datestamp, keyword3, ch1, ch2, ch3, ch4) VALUES (?,?,?,?,?,?,?)"\
,(jk,date,keyword1,results[8],results[9],results[10],results[11]))
c.execute("INSERT INTO adresult4(ID, datestamp, keyword4, ch1, ch2, ch3, ch4) VALUES (?,?,?,?,?,?,?)"\
,(jk,date,keyword1,results[12],results[13],results[14],results[15]))
conn.commit()
And for the first bit that’s it, when you run the AtoD program the values will be stored into the database.
Step 7: MatPlotLib Draw a Graph From the Data in the Database


For my application (discharging and charging batteries) I close down the AtoD program once I have finished taking readings. Then I run another program to read the data from the database and plot a graph. (if you wish to keep taking readings then you don’t need to close down the program as you should be able to graph whilst it is
still logging.)
The python program uses MatPlotLib to draw the graph and you can select loads of different graph types and options. For me I am only interested in the A/D value and the time as this will give me a discharge/charge graph. So the graph type is plotTime and you read the data from the database line by line and format the data by removing the unwanted characters and store as a CSV. Then from the 4 items in each row you select the required parts which in my case is part [1] (the second part) which is the real time and part [3] which is the required A/D value.
The time needs to be corrected from the string to a useable number date.
Once all the data is retrieved from the database and formatted it is then drawn on a graph.
In the future I would like to get a live updating graph on the screen, but for the time being I am happy with what I have achieved!
Step 8: The Full Program (reading A/D and Store Results in Database)
from smbus import SMBus
from Tkinter import *
import math
import time
import datetime
import sqlite3
conn = sqlite3.connect('database03.db')
c = conn.cursor()
keyword1 = "ch01"
keyword2 = "ch02"
keyword3 = "ch03"
keyword4 = "ch04"
jk = 0
resolution = 3
bus = SMBus(1)
analogDev = [0x68,0x69,0x6a,0x6b] #address of A/D chip
chan = [0x18,0x38,0x58,0x78] #channels used on chip
results = []
def dataEntry():
c.execute("INSERT INTO adresult1(ID, datestamp, keyword1, ch1, ch2, ch3, ch4) VALUES (?,?,?,?,?,?,?)"\
,(jk,date,keyword1,results[0],results[1],results[2],results[3]))
c.execute("INSERT INTO adresult2(ID, datestamp, keyword2, ch1, ch2, ch3, ch4) VALUES (?,?,?,?,?,?,?)"\
,(jk,date,keyword1,results[4],results[5],results[6],results[7]))
c.execute("INSERT INTO adresult3(ID, datestamp, keyword3, ch1, ch2, ch3, ch4) VALUES (?,?,?,?,?,?,?)"\
,(jk,date,keyword1,results[8],results[9],results[10],results[11]))
c.execute("INSERT INTO adresult4(ID, datestamp, keyword4, ch1, ch2, ch3, ch4) VALUES (?,?,?,?,?,?,?)"\
,(jk,date,keyword1,results[12],results[13],results[14],results[15]))
conn.commit()
def getadreading(address,adcConfig):
adcreading = bus.read_i2c_block_data(address,adcConfig)
h = adcreading[0]
l = adcreading[1]
s = adcreading[2]
while (s & 128):
adcreading = bus.read_i2c_block_data(address,adcConfig)
h = adcreading[0]
l = adcreading[1]
s = adcreading[2]
t = (h << 8) | l
t = t / 16384.0
return t
def readValues():
for i in range (0,len(analogDev)):
for b in range (0,len(chan)):
k = getadreading(analogDev[i],chan[b])
results.append(round(k, resolution))
date = str(datetime.datetime.fromtimestamp(int(time.time())).strftime('%Y-%m-%d %H:%M:%S'))
readValues()
h = 15 + (len(results))* 20
w = 215 +(resolution * 10)
s = 22
window = Tk()
canvas = Canvas(window, width=w, height=h, bg="grey")
canvas.pack()
for b in range (0, len(results)):
canvas.create_text(80, s+(b*20), text = 'Analogue Reading ')
canvas.create_text(150, s+(b*20), text = b)
canvas.create_text(175, s+(b*20), text = "=")
window.update()
results = []
while True:
now = time.time()
date = str(datetime.datetime.fromtimestamp(int(time.time())).strftime('%Y-%m-%d %H:%M:%S'))
readValues()
for i in range (0,len(results)):
canvas.create_rectangle(180, (s+(i*20)-10), w,s+((i*20)+10), outline = "grey",fill = "grey")
canvas.create_text(195, s+(i*20), anchor=W, text = results[i])
window.update()
dataEntry()
jk = jk + 1
results = []
endTime = time.time()
time.sleep(5 - (endTime - now))
Step 9: Programs for Making Database and Plotting Graph
import math
import time
import datetime
import sqlite3
# to run this program
# open terminal and nagigate to the directory then type "sudo python makedb.py"
# this will make the db in the current directory where the program is
conn = sqlite3.connect('database03.db')
c = conn.cursor()
c.execute("CREATE TABLE adresult1(ID INT, datestamp TEXT, keyword1 TEXT, ch1 REAL, ch2 REAL, ch3 REAL, ch4 REAL)")
c.execute("CREATE TABLE adresult2(ID INT, datestamp TEXT, keyword2 TEXT, ch1 REAL, ch2 REAL, ch3 REAL, ch4 REAL)")
c.execute("CREATE TABLE adresult3(ID INT, datestamp TEXT, keyword3 TEXT, ch1 REAL, ch2 REAL, ch3 REAL, ch4 REAL)")
c.execute("CREATE TABLE adresult4(ID INT, datestamp TEXT, keyword4 TEXT, ch1 REAL, ch2 REAL, ch3 REAL, ch4 REAL)")
import math
import time
import datetime
import sqlite3
import numpy as np
import matplotlib.pyplot as plt
import matplotlib.dates as mdates
conn = sqlite3.connect('database02.db')
c = conn.cursor()
wordUsed = 'ch01'
graphArray = []
font = {'family' : 'serif','color' : 'red','size' : '20'}
for row in c.execute('SELECT * FROM adresult'):
startingInfo = str(row).replace(')','').replace('(','').replace('u\'','').replace("'","")
splitInfo = startingInfo.split(',')
graphArrayAppend = splitInfo[1]+','+splitInfo[3]
graphArray.append(graphArrayAppend)
datestamp, value = np.loadtxt(graphArray,delimiter=',', unpack=True, converters={ 0: mdates.strpdate2num(' %Y-%m-%d %H:%M:%S')})
plt.plot_date(x=datestamp, y=value, fmt='b-', label = 'Tank Level', linewidth=1)
plt.xlabel('Real Time 24hr clock', fontdict=font)
plt.ylabel('Voltage (V)', fontdict=font)
plt.title('Battery Charge Test, AA battery GP Fast Charger', fontdict=font)
plt.show()

Runner Up in the
Raspberry Pi Contest

Participated in the
Epilog Contest VII


