

Introduction: Realtime Temperature Sensor and Dashboard


Microcontrollers are getting cheaper, more powerful, and more flexible. New modules and sensors continue to create new use cases, and the Internet of Things continues to skyrocket.
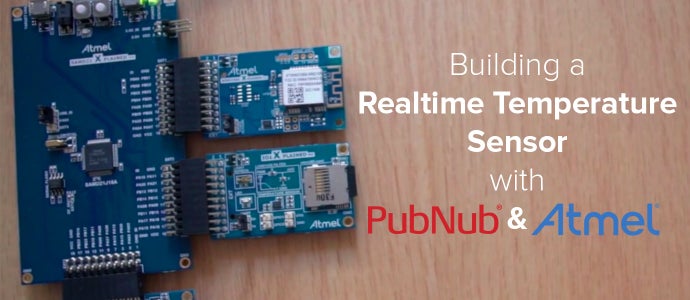
Beyond just collect or detecting data, we want to do something with our data. We thought a great way to showcase an application of this sorts would be to create a temperature sensor that streams data in realtime to a live-updating dashboard.
In this tutorial, we're using an Atmel MCU to collect the temperature, and the EON, an open source JavaScript framework to stream and publish the data to our dashboard. The PubNub API powers the data streaming.
Step 1: The Concept

- The Atmel I/O1 Xplained Pro sensor measures the ambient temperature.
- This connects to the Wi-Fi using the ATWINC1500 module.
- The PubNub code running on the Atmel chip enables us to publish the temperature in real time to any one subscribing to the same channel as a data stream.
- Through the PubNub Developer Console, you can receive this stream of information from as many sensors as you like in realtime to our live-updating chart (powered by EON).
Step 2: Hardware

- ATSAMD21-XPRO host MCU board.
- OLED 1 Xplained Pro to provide the display on the chip.
- Atmel I/O1 Xplained Pro for sensor and SD-card input to host MCU
- ATWINC1500 module. This is a Wi-Fi black box that contains the Wi-Fi stack, the TCP stack and the TLS stack.
Step 3: Getting Started: Software
- Windows PC
- To get your unique pub/sub keys, you’ll first need to sign up for a PubNub account. Once you sign up, you can get your unique PubNub keys in the PubNub Developer Dashboard. Our free Sandbox tier should give you all the bandwidth you need to build and test your messaging app with the web messaging API.
- Install Atmel Studio 6.2
- Install updates to Atmel Studio as suggested during installation
- Install terminal software like putty or teraterm (I have used putty)
A prerequisite is that you upgrade the firmware for SAMD21 using the .bat file provided with the PubNub Atmel example before you run this demo. Make sure no other software like putty or teraterm is using the com port). Close Atmel Studio and the putty terminal. The firmware upgrade is successful if you see a PASS sign on the terminal after running the code.
Step 4: Connecting the Hardware

- Connect WINC1500 XPRO board to SAMD21 XPRO connector EXT1
- Connect I/O1 XPRO board to SAMD21 XPRO connector EXT2
- Connect OLED1 XPRO board to SAMD21 XPRO connector EXT3
- Connect SAMD21 XPRO to a free USB port on your PC (make sure no other USB port on your PC is in use)
- Connect the power to the port that says “DEBUG USB”
Step 5: The Software

Let's get coding!
Open the PubNub example: pubnubAtmel/PubNub_EXAMPLE.atsln (included in the code download) in Atmel Studio and you will see the following page. Make sure you choose the debugger/programmer and interface as shown in the image
Step 6: Include the Following Lines in PubnubAtmel/src/main.h
#define TEST_MODE_SSID "Enter-your-SSID"    (choose THE Wi-Fi access point you want the chip to connect to)
#define TEST_MODE_PASSWORD "Enter-the password-for-the-SSID" (enter the password for the same Wi-Fi connection)
#define TEST_MODE_WITHOUT_PROVISION
Step 7: In PubnubAtmel/src/main.c, Add the Channel Name and Pub, Sub Keys.

Step 8: Build (F7 / Build -> Build Solution), Run(continue/ Green Arrow/ F5/ Debug -> Continue).

Step 9: Start Streaming Data

Open PubNub Developer Console, use the same channel name and pub,sub keys as in the code and SUBSCRIBE.
If all is well, you should see a constant stream of messages in the following format : {“columns”:[["temperature","55.00"]]}
Step 10: Visualizing the Data Stream
Let's put EON to work! All the code you need is available at the beginning of the blog post.
The charting and graphing component of EON is based on C3.js, an open source charting library. This enables you to build realtime line, bar, pie, gauge, and donut charts. When new data is streamed, transitions are animated and changes are reflected in realtime. No manual refreshing required!
We didn’t just want to display raw data off the sensor as a live-updating number. That’s boring. So my partner-in-crime Tomomi built our beautiful temperature visualization, which you can see above! It mocks nursery or greenhouse monitor (a typical, realworld use case for realtime temperature sensors).
The interface is runs in the browser, and the technology behind is quite simple, using PubNub JavaScript APIs to subscribe the data sent from the Atmel chip. Because our interface is simple, lightweight, and built entirely in JavaScript, it’s accessible from anywhere in the world with any kind of device – mobile phones, tablets, and any smart device, as long as you have a web browser. The main purpose behind this is to present information in most efficient manner without losing its accuracy.
In this scenario, the UI shows the current temperature, also a simple line graph, updating in realtime so that you can tell the relative changes of the temperature, raising and dropping. This particular data is simple, but when you have multiple, more complicated data, data visualization plays more crucial role.


