Introduction: Shadow Stick Navigation and Graph of Solar Paths.


by tonytran2015 (Melbourne, Australia).
In the 1950's some maps have their graphs of Solar paths printed next to the compass roses. A graph of Solar paths helps the users of that map (for some certain small area) in orientating it correctly using only the direction of the Sun and the approximate time (month) in the year. It also help people visualize the direction of the Sun at each time of the year relative to a building. For some unknown reasons, graphs of Solar paths are all replaced by compass roses in modern maps. The roses take up nearly the same areas while give less information,.
A graph of Solar paths can also be used on its own with a vertical stick in the center to tell (local) time and direction. This application is suitable to day time navigation of vehicles as it relies only on the Sun and needs no battery.
This posting shows how to use and make a graph of Solar paths for your own map or for use on its own.
Step 1: Description of the Basic Graph of Solar Paths.

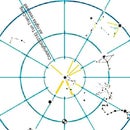
Figure: A typical graph of Solar path. This particular graph is made for 10 degrees North, for use in Saigon (around Tan Son Nhat International Airport).
The graph of Solar paths is a circular disc with concentric circles and radial lines bearing division marks to represent the elevation and azimuth angles of the Sun at different times of principal days.
The perimeter circle of the graph is graduated into 360 degrees to show the azimuth angle of the Sun from True North. It can also be used as a protractor for measuring angles. The concentric circles are the constant elevation circles.The radial lines are graduated 0 to 90 to show the angle from zenith to the Sun. The circle 90 degrees from the zenith represents the horizon in flat locations. The graduation can also be read from the horizon circle toward the center to show the elevation angle of the Sun.
All positions of the Sun at various time on an equinox day are plotted to make a Solar path for that day. The paths for the Sun on two solstice days are similarly plotted. The time for the each Solar position on a path is also given by time marks such as 6hr, 12hr and 18hr.
It is assumed here that the Sun attains its highest elevation at noon of local time everyday (the duration of the day is therefore slightly longer or shorter than 24hr, to discount any effect from the Equation of time).
Step 2: Using a Graph of Solar Paths.
Be certain that the graph is for your current latitude! If it is printed on a map, it is for the latitude of that area.
The following steps show how to use the graph on an equinox day:
1/- Point your index to the Sun.
2/- Point your middle finger horizontally.
3/- Hold still the two fingers and measure the angle between them by placing those fingers along two radial lines of the Graph of Solar paths. Read the value of the angle. It is called the elevation angle of the Sun.
4/- Follow the Solar path for that day on the graph to its 2 points having that elevation value. The two intersection points give two times (one before and one after noon) and two positions of the Sun.
5/- Choose the one of those two points fitting your half day (either before or after noon-time).
6/- Lay the graph of Solar path horizontally. Rotate the graph until the line from the graph center to the chosen intersection point goes beneath the Sun.
7- The 0 degree azimuth line of the graph is now aligned along the direction of the true terrestrial North.
For any other day of the year, use the particular path for it. A graph supplies at least three paths: for summer solstice day (21 June for Northern Hemisphere), for equinox days (21 March and 23 September), and for winter solstice day (21 December for Northern Hemisphere). The path for any other day can be interpolated from these three.
Step 3: Interpolation for Any Arbitrary Day of the Year.

Figure: Graph of Solar declination for various days of the year.
The declination value for any day varies between the principal values for solstice and equinox days and its solar path varies similarly.
The rough graph here allows the estimation of how close the Solar path of any day is to its two neighbouring bounds for the equinox and solstice days.
Step 4: Making a Graph of Solar Path for Your Latitude.

Figure: The Celestial sphere directly above a circular disc of the same diameter.
The following steps show how to make your own graph of Solar paths for your arbitrarily chosen latitude.
1/-Draw 9 equidistant concentric circles and 12 (or 36) equally spaced radial lines as the frame for the planar polar coordinate system.
2/- Place this disc (as the frame) on a horizontal plane.
3/-Set the angle between 2 divider legs to be 90 degrees.
4/-Place the hinge of the divider exactly above the center of the disc. It should be at the center of the sphere in the figure.
5/- Hold the first leg of the divider pointing downward, inclined by latitude angle, in the 180 degree or 360 degree direction depending on your Lower Celestial pole being South or North Celestial pole. The first leg point downwards along the Celestial axis in the figure.
6/- The second leg will point at different directions to the Sun for different times of the day when the divider is rotated about the first leg. It uppermost position corresponds to mid-day.
7/- Looking downwards along the first leg of the divider gives the picture of a 24 hour clock with the second leg being the hour hand. The clock dial is clockwise when you are in Northern hemisphere and anticlockwise when Southern.
8a/- Looking at the second leg from the top of the disc gives azimuth angle of the Sun.
8b/- Looking at the second leg from its side gives elevation angle of the Sun.
9/- Record on the polar graph on the disc the direction of the second leg for 6hr, 12hr and 18hr.
10/- Join the curve by a smooth curve. (Additional points may be added for a more precise curve).
11/- The curve is the Solar path for equinox days.
12/- Set the angle between the divider legs to 90+23.5 degrees and repeat steps 4 to 10 to draw Solar path for summer solstice day.
13/- Set the angle between the divider legs to 90-23.5 degrees and repeat steps 4 to 10 to draw Solar path for winter solstice day.
The graph of Solar paths is now COMPLETE. It is usable with only 3 paths for equinox and solstice days. Paths for other days can be interpolated from them.
Manually drawn graphs are accurate enough for normal usage. If all steps are simulated with your computer, the graph will be very accurate.
If you live near to 20 degrees N latitude (20 degrees is only an example value) and need a graph for your personal use but don't want to spend time drawing it, you can do a Google search for "graph solar path 20 degrees". The search results will give many ready made graphs and you can select one of them for your own use.
Step 5: Application 1: Shadow Stick Navigation for Vehicles.
You can print your graph on a disc for use in your vehicle. You can use only one single disc if the vehicle does not travel more than 5 degrees = 300 nautical miles = 555km in latitude from your base.
Lay the rotatable disc horizontally with a vertical stick at its center. When the shaddow of the stick is on the opposite side of the chosen point on the graph, the line of 0 degree points exactly at True North. This method of Solar navigation only needs the graph and a vertical stick and is immune to vehicle shocks and stray magnetism.
This method needs the above device and is less general than my method given in reference [1] but may be easier for users to comprehend.
Step 6: Application 2: As a North Direction Marker

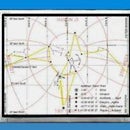
Figure: Map of an old citadel overlaid on a modern satellite based map. The graph of Solar paths is given on bottom left corner instead of the compass rose.
The illustration is the map of an old citadel overlaid on a modern satellite based map. The graph of Solar paths is given on bottom left corner instead of the compass rose. The graph of Solar paths gives more useful information than a compass rose occupying same area.
Notes on my composite map: The modern map data are used under Open License from Open Street Map, the data are owned by Open Street Map Contributors. The old area has adjusted and selected data from a 150 year old map with expired Copyright.
Step 7: Additional Observations.
The graph of step 1 shows that the Sun can travel on the other side of your zenith when you are in a tropical zone. This explains why the bisector method using a horizontal watch may give you an error of 180 degrees around summer solstice (see reference [2]).
The graph shows that the terrestrial direction (azimuth) angle of the Sun varies quickly with time when the Sun is close to the zenith point. This quick change in direction may be main the reason for the ancient custom of cross-country travelers to take their rest when the Sun is near to their zenith.
You can also use a graph for your EXACT latitude to calculate if and for how long a proposed neighbouring tall building may over-shadow your house. Architects have been using graph of Solar paths and physical sunlight simulator on their scale models even before 1914.
References.
[1]. tonytran2015, Finding North direction and time from the Sun using bare hands, Instructables, https://www.instructables.com/id/Find-North-direct... ,uploaded 2015 may29, most recently accessed 2016, March29.
[2]. tonytran2015, Caution in finding North by bi-sector line, Instructables, https://www.instructables.com/id/Caution-in-findin... ,
posted 11 June, 2015.