

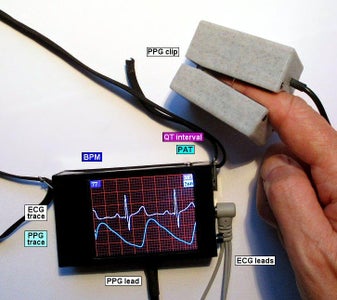
Introduction: ECG With PPG Using Arduino


A plethysmogram is a graph of blood volume vs time and a photoplethysmogram (PPG) uses light to measure blood volume, often with a finger probe.
You can buy a pulse oximeter very cheaply on eBay. It uses photoplethysmography to measure your heart-rate. By comparing the absorption of IR versus red light, it can also measure blood oxygen saturation. It's straightforward to build a PPG that measures red and IR absorption but calibrating it is a problem. The PPG described here only uses IR light.
This project is an add-on to my ECG project - I'm going to assume you've already built the ECG hardware. The additional hardware and software described here displays a photoplethysmogram next to the ECG trace. A probe clips on your finger and passes infra-red light through it. The amount of IR received is a measure of the blood volume in your finger.
There are two circuits you can use to collect the PPG data:
- build your own amplifier
- use an AD8232 module
Building your own amplifier is slightly cheaper and you probably already have all of the components. An AD8232 module is less work but you have to wait for it to be delivered.
To build the original ECG project, you will need an Arduino Nano, an ILI9341 320x240 SPI display, an AD8232 module, a battery of some sort, a pushbutton and some resistors.
I've included a design for a 3D printed PPG clip or you can use a piece of PVC plumbing pipe.
The new software includes code to calculate the QT-interval of the ECG signal. If you have built my ECG project, you can upgrade that project to display the QT-interval. (See the "Analysis" Step below.) You don't need to build PPG hardware.
This is not a medical device, it's something you're building for fun. See the full disclaimer in Step 2 of my ECG project.
Step 1: What Does a Photoplethysmogram Show?


A PPG wave has a fast rise and a slow decline. During the decline there is a second peak. The first peak is the "systolic peak" and the second peak is the "diastolic peak". The dip between the two peaks is the "dicrotic notch".
The systolic peak is due to the pulse of blood arriving from the heart after systole (when the ventricles contract). The diastolic peak is due to reflection of that pulse from other parts of the arterial system. There is a reflection from anywhere there's a sharp change in impedance. The major reflection is from the junction of the aorta and the iliac arteries. There are others from earlier junctions but they tend to get hidden in the systolic peak of the PPG.
The size of the diastolic peak varies with where on the body you measure the PPG. It is quite large on the forehead and almost disappears at the toes.
The size of the diastolic peak also varies with age. It is quite large for young people and becomes smaller with age. The dicrotic notch is also large for young people and becomes smaller with age.
The heart rate can easily be measured using PPG and hence PPG can help detect arrhythmia, tachycardia, atrial fibrillation, etc. But they can also be detected using the ECG trace.
The overall height of the PPG wave can be used to detect your breathing rate. There is decreased pulse amplitude and heart rate increases during inspiration. These effects are quite small and there are easier ways to detect respiration.
The time between the R wave of the ECG (the biggest peak) and the steepest part of the rise towards the systolic peak of the PPG is called the Pulse Arrival Time. (There are other slightly different definitions: some people measure to the top of the systolic peak and some measure to the start of the systolic peak.)
The Pulse Transit Time is the time taken for the pulse to travel from, say, the shoulder to the finger or the face to the toe.
- PAT (pulse arrival time) - the time for the pulse to get from the heart to the PPG probe
- PTT (pulse transit time) - the time for the pulse to get from, e.g., the shoulder to the finger
But some people refer to both as Pulse Transit Time.
I'm going to refer to the time from the R-wave to the finger as PAT.
A typical PAT is in the range 200mS to 300mS. Of that, around 35mS is the time it takes for blood to begin to leave the heart after the peak of the R-wave.
Both Pulse Arrival Time (PAT) and Pulse Transit Time (PTT) can be used to estimate blood pressure, arterial stiffness, atherosclerosis, arteriosclerosis, etc. However there is a lot of natural variation between individuals. The relationship between PAT and blood pressure has to be calibrated for each person. PAT may be useful to signal a sudden change in blood pressure, for instance, during a clinical procedure; it could signal the change faster than a cuff would.
PAT is a poor way to measure blood pressure. PTT is slightly better particularly when is is combined with a measure of heart-rate. If you search the web, you'll find hundreds papers trying to predict blood pressure form PPG but, to my mind, no-one has succeeded.
The overall height of of the PPG is proportional to the pulse pressure. Pulse pressure is the difference between the systolic and diastolic pressure in the arteries. Higher pulse pressure may increase the risk heart attack or stroke. It may indicate atherosclerosis and stiffer arteries. Of course, the amplitude also depends on how far you've poked your finger into the PPG clip.
PPG is an active area of research. The bottom line is that it may be useful for diagnosis or it may not. The normal differences between individuals may be larger than the differences due to various health conditions. This plot (above) shows the problem. For each individual, there is a correlation between PAT and blood pressure but it is swamped by the differences between individuals. So it seems that you can use PPG to monitor changes in an individual but not compare that individual to the general population.
Normally, when heart-rate rises so does blood-pressure and so PAT falls. But with internal bleeding, blood-pressure will fall, heart-rate will rise to compensate but PAT will rise too. Imagine using PPG in an emergency. This paper shows that 800ml blood loss gives 50% longer PAT (in anaesthetised pigs). To me, that seems the most useful thing that PAT can reveal.
There are many good reviews and discussions online. This paper reviews 118 articles and this one reviews 162 articles. Other reviews are here and here.
Step 2: AD8232 Circuit


Skip to the next Step if you are building your own amplifier.
The AD8232 chip contains a high quality, low noise instrumentation amplifier and signal conditioning to remove noise. It is intended primarily for recording ECG but it works very well to record a PPG signal.
Buy a module like the one in the photo. Search eBay for "AD8232 module" or "ecg module". You don't need one with leads and electrode pads. You should already have a similar module measuring ECG.
R8 and LED1 produce infra-red light which passes through your finger to PD1. The current through PD1 produces a voltage across R1. That voltage is AC-coupled to the RA and LA inputs of the AD8232 module. The RA and LA inputs of the AD8232 module are connected to the RL (driven ground) output of the AD8232 through 1M resistors. That keeps the voltages at RL and RA in the correct range.
You can connect the PPG circuit to the AD8232 module using a 3.5mm jack plug or just solder the wires into the holes in the AD8232 PCB.
I suggest that you build the circuit on stripboard - it has very few components.
The value of R6 determines how large is the PPG signal. Try values between 100R and 470R.
The module produces mains hum when you connect the circuit to a computer with a USB lead. The hum goes away when the unit is disconnected.
Step 3: Home-made Amplifier Circuit


Skip to the next Step if you are using an AD8232 module.
The circuit consists of an IR LED emitter, an IR phototransistor receiver and an amplifier/filter based on an LM358 op-amp.
The current through the phototransistor produces a voltage across R1. That voltage is AC-coupled to the input of U1a (with a cutoff frequency of 3Hz). U1a has a V/V gain of 22x. C1 gives a slow roll-off above 7Hz. The circuit around U1b makes a low-pass Butterworth filter of around 10Hz with a V/V gain of 3x. Analog publish a good filter design tool here.
R1 is AC-coupled to U1a because if it is DC-coupled then changes in the overall light level shift the voltage across R1 and might drive the op-amp output to the power rail. If there is no finger in the clip then R1 goes to 5V (or whatever the power level is). When you insert a finger, it takes up to 10sec for C1 to discharge to a reasonable input level for U1a. D1 stops R1 going above Vf of D1 (about 0.6V for a silicon diode). The circuit will work fine without D1 but it takes ages to get going. D1 can be any small-signal silicon diode.
The IR LED is driven through a 270 ohm resistor giving a current of 15mA to 18mA. IR LEDs can often take up to 50mA but I wasn't wanting to drain the battery too quickly.
The output signal from U1b is around 1V high.
The IR emitter and receiver should have a wavelength in the range 900nm - 940nm. Those wavelngths will pass through skin, muscle blood, etc. But they will be partially blocked if you have dark skin - that's because the job of melanin is to block light.
Choose an IR transmitter that matches the wavelength of the receiver. I chose
- IR LED = L-34F3C
- IR phototransistor = L-3DP3C
which peak at 940nm. Many other LEDs and phototransistors would work equally well - I happened to have lots of those ones. Search eBay or your favourite supplier for "IR LED" and "IR phototransistor" and choose ones that are 3mm dia. Make sure the wavelength is in the range 900nm - 940nm.
The circuit is powered by a lithium cell (up to 4.2V) or from 4xAA cells (see Step 12 of my ECG project). So the "5V" in the schematic just means either 4V from the lithium cell or 5V from the Arduino.
If you were building this as a medical device, you'd use different filtering. You'd worry about the phase-shifts introduced by the filters - Chebyshev and Butterworth filters have different phase-shift. And you'd use a better quality op-amp!
Step 4: Building the Circuit


If you you have built your own amplifier:
I built the circuit on stripboard. It's a simple circuit and I'm far too impatient to wait for a commercial PCB. To keep the area small, I mounted most of the resistors vertically. The board is 1"x2" and is 15mm high. You can see the layout I used. If you prefer to use a "real" PCB then you can use SM parts to keep the height down.
The phototransistor is mounted in the centre of the board. The board is held in place in the clip with foam rubber arranged so the phototransistor pokes through a hole in the clip.
The LED is mounted in the other half of the clip on the end of wires. It is glued in place - I used UHU which is strong enough to work but can be pulled apart if you need to.
If you are using an AD8232 module:
The phototransistor, LED, R6 and R8 can be assembled inside the PPG clip. The R7, R11, C7 and C8 can be soldered onto a small piece of strip-board inside the case of your ECG.
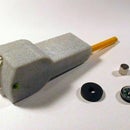
Step 5: Probe Clip


I used a 3D-printer to make the probe clip. The STL files are attached below.
As is usual with 3D-printing, you'll need to sand, file and drill the pieces so they fit. You'll need a 3.5mm (and maybe a 4mm) drill for the LED holes and maybe a 1.5mm drill for the screw-holes (depending on what screws you use).
The CAD model was designed using Designspark Mechanical. A free version can be downloaded from RS components. My Designspark source files are available here.
I lined the clip with 1mm thick soft rubber from an old mouse-mat. It makes a better light-proof seal to your finger and is more comfortable. Bicycle inner-tube would also work.
The two halves of the clip are held together by bent wire and springs. I used a spring from a ballpoint pen that I cut in half. The wire is 0.5mm steel; a fine paperclip might work.
The clip is screwed together with 2x6mm self-tapping screws. Search eBay for "M2 countersunk self tapping screw". I find they're a useful size for assembling small 3D-printed items.
During development, I taped the LED and phototransistor into the walls of a black plastic tube. If you don't want to 3D-print a clip, you could make a more permanent version of that setup perhaps by using PVC plumbing tubing. "1/2 inch" pipe has an outside diameter of 21.4mm and an inside diameter of 18.0mm which should be OK unless you have particularly large fingers.
Alternatively, you could take a commercial pulse oximeter apart. The cheapest is under £6 on eBay. (For £7 you can buy two - one to use in this project and one to use as an oximeter.)
If you are using an AD8232 module: You don't need a big box on the PPG clip to house the amplifier - it's inside the case of the ECG. So print two copies of the smaller, "upper" box.


Step 6: ECG Unit Hardware


This plethysmogram is an add-on to my ECG project. The output from the PPG is connected to the A4 analogue input of the Arduino.
I decided to use a 3-pin 0.1" Molex connector. A stereo jack would look nicer but the AD8232 module of the ECG already uses a 3.5mm jack. It's important that the two connectors cannot be confused: you don't want to connect the 5V supply to the ECG electrodes attached to your body. A 2.5mm stereo jack would be better than a 0.1" Molex but I didn't have a 2.5mm plug/socket to hand.
You can see how I have fitted the PPG socket into the (rather crowded) ECG case. No doubt, your layout will be different.
If you you have built your own amplifier: The three wires connect to 0V, 5V and A4 of the Arduino Nano.
If you are using an AD8232 module: The phototransistor, LED, R6 and R8 can be assembled inside the PPG clip. The R7, R11, C7 and C8 can be soldered onto a small piece of strip-board inside the case of your ECG.
Step 7: Analysis


The interval between the ECG and the PAT is calculated.
PAT is measured from the peak of the ECG R-wave to somewhere in the systolic peak. Some researchers measure to the top of the systolic peak and some measure to the biggest upward slope of the systolic peak (which is what this sketch does).
The PAT value that the program displays is the calculated PAT filtered through an order-5 median filter and a low-pass filter. A median filter is useful when noise give rise to a couple of really weird values. The low-pass filter stops the displayed values changing too quickly.
To enable PAT calculation ensure that bHasPAT is defined near the start of the sketch.
#define bHasPAT
The sketch can also estimate the QT interval. To enable QT estimation ensure that bHasQT is defined near the start of the sketch.
#define bHasQT
QT interval is a useful measurement in predicting ventricular arrhythmias. "Long QT syndrome" can be congenital or due to various medications or drugs.
It is hard to automate the calculation and many doctors don't trust automated systems. There are lots of different attempts at algorithms which implies to me that the problem has not been "solved". The result you get can depend on where you've placed the leads.
The QT interval is defined to be the time from the start of the Q-wave to the end of the T-wave. The start of the Q-wave is the time at which the ECG signal starts to dip just before the large R spike. The end of the T-wave is where a line drawn through the falling part of the T-wave meets the baseline. In textbooks, it looks easy.
In the real world it's much harder. There is noise in the signal. Where is the "baseline"? What is the slope of the T-wave? Where do you measure it?
The rest of this Step describes my solution. You can skip it unless you're interested in the maths.
The start of the Q-wave is easy. It's the sample after the last time the differential of the signal was positive before the R spike. You have to smooth the signal to remove the worst noise. I say that the Q-wave is easy because the Q-wave is so quick that any mistake you make will only affect the estimated QT-interval by a few milliSeconds.
The T-wave is harder because it's slower and more vague. The algorithm I've developed for finding the end of the T-wave is as follows.
The ECG signal is differentiated and smoothed. The peak of the R-wave corresponds with the biggest value of the differentiated ECG signal.
The peak of the T-wave is located. It is the highest value of the ECG signal that is between 200mS and 500mS after the R-wave.
Once the peak of the T-wave is found, the program calculates the regression line of the signal from the peak to 100mS after the peak. The program starts collecting:
- the sum of a
- the sum of T
- the sum of T*a
- the sum of T*T
(where 'T' is the time since the R-peak and 'a' is the ECG signal)
The summing stops 100mS after the R-peak and the line is calculated. However the values are weighted so that values half through the 100mS interval are worth more.
The values that have been summed allow us to calculate the regression line.
You will have been taught the formula for regression in any statistics course:
a = (Σxy - Σx*Σy/n)/(Σx²-Σx*Σx/n);
b = (Σy-a*Σx)/n;
(where y = ax + b}
The end of the T-wave is where the line crosses the "baseline" but where is the baseline?
The ECG signal is exponentially smoothed. When each sample arrives, it is smoothed using
smoothed_sample = smoothed_sample*alpha + sample*(1-alpha);
Alpha ought to be calculated as
alpha = exp(-1/Tau);
but it can be approximated more cheaply as
alpha = 1 - 1/Tau;
The bigger Tau (the time-constant) the more the signal is smoothed; i.e. the more slowly the smoothed signal changes.
The estimated baseline is an exponentially smoothed copy of the signal. The time-constant of the exponential is longer when the signal is further from the current estimated baseline:
- "sample" is latest sample
- diff is (first derivative of sample)²
- ds is diff smoothed with time_const=20mS
- Tau = 2*(ds+sqr(sample-baseline)+1)
The baseline is "sample" (the latest sample) smoothed using a time-constant of Tau. So the baseline changes slowly due to big sudden changes (like the R-wave and T-wave) but stays close to (what a human thinks is) the true baseline.
The "first derivative of sample" is, in fact, sample[i]-sample[i-n]. Where n is chosen to be around 20mS before. (The larger the value of "n", the more the differential is smoothed.)
I admit, a lot of the algorithm is rather arbitrary but it works at least as well as other algorithms you can find in scientific papers. The images above show the results when applied to a database of typical "real world" recordings that contain all sorts of errors.
The normal QT interval is in the range:
- Men 390 - 450ms
- Women 390 - 460ms
but it depends on the heart-rate. The QT interval is therefore adjusted to compensate for heart-rate to give QTc.
Several compensation formulae are used:
- BazettQTc = QT/sqrt(RR/1000)
- FridericiaQTc = QT/((RR/1000)^(1/3))
- FraminghamQTc = QT + 0.154 * (1000 - RR)
- HodgesQTc = QT + 1.75 * (BPM - 60)
(QT and RR are in mS. RR = 60000/BPM)
Graphs of those formulae are shown above: a QT interval of 400mS is "compensated" for various heart-rates.
This paper compares the formulae (for over 6000 patients). It rejects Bazett completely and recommends that Fridericia is slightly better than the others. Therefore I have chosen the Fridericia formula. In fact, I've re-calculated the Fridericia formula as a quadratic equation so as not to have to calculate a cube root (which is very slow on a Nano). Let's call it "Peter's formula":
- Peter's formula: QTc = QT * ((0.00728 - 0.0000164*BPM)*BPM + 0.622)
It gives the same answer as the Fridericia formula to better than 0.5% over the normal range QT interval and heart-rate.
The QTc value that the program displays is the calculated QTc filtered through an order-5 median filter and a low-pass filter.
Step 8: ECG Unit Software


The PPG signal is shown when the ECG software is in the "Large display" or "Small display" mode. The PPG trace is drawn in cyan.
Download the files below. Copy the following files to a folder called ArduECGPPG:
- ArduECGPPG.ino
- SimpleILI9341.h
- SimpleILI9341.cpp
Turn off warnings. My code produces a lot of warnings which I find excessive and unhelpful. In the Arduino IDE (ver 1.8 or higher) select the File|Preferences menu item to open the Preferences dialog. Set Compiler Warnings to "None". Close the dialog.
To enable the PPG trace, ensure that bHasPPG is defined near the start of the sketch.
#define bHasPPG
If you comment it out then none of the PPG code will be executed.
In Small mode, the program can show a chart of how the heart-rate and PAT have changed over the last 15 minutes. In the example above, you can see how heart rate increased during exercise while PAT decreased.
To enable the chart ensure that bHasChartMode is defined near the start of the sketch.
#define bHasChartMode
Compile the files and upload them to the Nano.
If you you have built your own amplifier:
In ArduECGPPG.ino, A4 (the PPG signal) is defined as
pinMode(A4,INPUT_PULLUP)
So that if the PPG clip is disconnected then the input is pulled up to 5V. The sketch recognises that the the PPG signal is high and doesn't display it.
If you are using an AD8232 module:
With the AD8232 module, that "pullup" trick doesn't work - the AD8232 always produces an output in the right range. However, when the PPG clip is disconnected from the AD8232 module, the module produces a lot of noise. So as an additional test, the sketch looks at the total "energy" (the total changes across the sweep). If the "energy" is greater than a threshold then the next sweep of the screen is not displayed.

Step 9: The Future


How can this project be taken forward?
You could save power by only turning on the LED when measuring - but then the amplifier must respond quickly and filtering must be done in s/w. You could measure the light level twice with the LED off then on and use the difference to compensate for ambient light levels.
It would be nice to save a whole day's worth of data. That's about 68Mbytes of data (assuming one-byte values). The write time of an SD card is very variable so I would probably use two Arduinos: one to collect the samples and one to buffer them and write to the SD card.
You could dispense with the ECG altogether. For instance you could display only the PPG and a Poincare display.
You could automate further analysis of the PPG signal. Researchers have tried to automate the measurement of various aspects of the PPG signal:
- the pulse arrival time (PAT)
- the rise time of the systolic pulse
- the fall time of the diastolic pulse
- the relative heights of the systolic and diastolic peaks
- the time from systolic peak to diastolic peak
- the amplitude of the systolic peak
- the depth of the dicrotic notch
- the areas of different parts of the curve
- the width of the PPG peak
They then attempt to correlate different measurements with blood pressure, stroke volume, arterial stiffness, atherosclerosis, pain level, breathing rate, emotional stress, etc. They look at the first, second and third derivative of the PPG and even use Fourier transforms and wavelet analysis. By comparing PAT for proximal and distal PPGs, the state of different arteries can be estimated.
The problem is that differences between individuals are large. It can depend on skin type, ambient light, limb length, body temperature, etc. You need to calibrate each individual so it is only useful statistically with large populations or to assess the ongoing response of an individual to treatment.
You could add a second PPG probe and measure both pulse arrival time and pulse transit time. This group use a clip as long as the finger with a PPG sensor at each end to measure pulse wave velocity. They claim that it's 90% accurate for systolic blood pressure and 63% accurate for diastolic blood pressure.
Various equations have been proposed:
- BP = a*ln(PTT) + b
- BP=a/PTT + b
- BP=a/(PTT+c)² + b
where a, b and c are constants. Unfortunately few people say what those constants are! Most agree you must calibrate each person. This group say you must also take heart-rate into account. And this group suggest these constants:
- t = 60000/HRbpm - PAT
- SystolicBP = 184.3 - 1.329*HRbpm + 0.0848*t
- DiastolicBP = 55.96 - 0.02912*HRbpm + 0.02302*t
(but those numbers don't work for me.)
PAT depends on blood pressure but also on "vascular tone" - the stiffness of the artery walls. PAT is shorter with higher blood pressure and also with higher vascular tone. There is a suggestion that vascular tone is related to the width of the PPG peak. Perhaps one could use the pulse width to remove the vascular tone component from PAT.
Some researchers think it may be possible to estimate BP just from the shape of the PPG signal. The relative pulse width at various heights of the PPG wave could be related to cardio vascular health.
You can try out your own algorithms on the the MIMIC database. This group claim very good results by using a neural-net trained on the database to predict BP from PGG; of course, as it's a neural net, you have no idea what it's doing. This group used hand-crafted algorithms. This paper. describes using a neural-net trained on their own data.
Blood-loss due to trauma has a large effect on PAT. You can get an ECG signal from your finger: it's poor quality but good enough to see the R-wave. Imagine incorporating an ECG electrode in the PPG clip on the patient's finger. Electronics with a screen is strapped to the wrist of the other hand; it too has an electrode. The display shows the current heart-rate, PAT and a "chart" display of the last 10 minutes. Rising heart-rate and rising PAT mean blood-loss.
Here is a good (10 years old) survey of the research. This group say toes are better than fingers. PAT and PTT may be better at predicting systolic BP than diastolic BP. "Vascular Health" may be estimated by comparing PPG from different parts of the body.
As you must have guessed by now, lots of people have lots of different ideas but no-one has managed to persuade the medical profession that their idea works.


