

Introduction: Graphing on an Arduino, the EASY WAY!


Sometimes when you're testing a sensor or debugging a value in an Arduino project, you want to see something other than numbers flying by in the Serial Monitor. However, you want to get the sensor working quickly, and you don't want to take the time to write code to graph it or display it in an intricate way.
Well, we can fix that :)
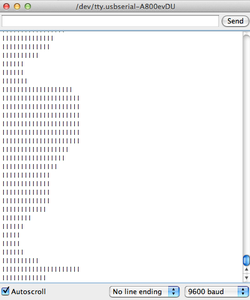
The trick is very simple. However it graphs it sideways, but hey, it's quick and easy.
The basic idea to graphing really quickly is this
print a basic letter, which can be a unit for the graph such as a lowercase L, l;
however, we want to print this letter repeatedly to emulate a graph.
Pseudocode:
//Gather Sensor Data;
// scale values down to a reasonable size
for(int i = 0; i < (The value you want to graph); i++) {
//print the letter you chose, such as "l";
// but print it all on the same line;
}
// now go to the next line in the Serial Monitor;
Here is some sample code to read and graph the input from AnalogPin A0;
void setup() {
Serial.begin(9600);
}
void loop() {
// Analog Sensor Connected to analog pin 0
int SensorVal = analogRead(A0);
SensorVal = map(SensorVal, 0, 1023, 0, 100);
for(int i = 0; i < SensorVal; i++) {
Serial.print("l");
}
Serial.println();
delay(50);
}

Finalist in the
Electronics Tips and Tricks

Participated in the
Pocket-Sized Contest


