

Introduction: How to Draw on an Oscilloscope With Arduino!


First, lets go over a few basics. An oscilloscope is a tool for visualizing changing electrical signals.
Oscilloscope: Oscillation (changing), scope (viewing). Together they make "oscilloscope"!
An oscilloscope works by plotting a voltage over time. That way, you can very easily visualize signals. On older analog scopes, they actually deflect an beam of electrons to make a moving dot on a phosphorescent screen to create a line. But newer digital oscilloscopes still work in pretty much the same way. Oscilloscopes are a very important tool in electronics because they allow engineers and technicians to see the electrical pulses and signals that occur inside electric circuits, even when they occur very rapidly.
It is an essential tool for electronics debugging, and is used by anyone who wants to better understand an electrical system. In this instructable, I'll be showing you how I got mine to display simple vector graphics with only an arduino and some resistors!
Step 1: Creating an Analog Voltage

Last summer, I purchased an old analog oscilloscope. Nothing fancy, just the basics I needed to get familiar with using a scope. I wanted to figure out how to use this piece of test equipment, and plus the glowing green screen and abundance of very clicky knobs looks (and feels) pretty cool.
One of the problems I had after I got my it, was that I had no signals to measure! With an Arduino or other microcontroller platform, you can easily make a 0-5V square wave by pulling a pin high and low in a regular patter. This is somewhat interesting, but is not using the scope to nearly its full potential.
My Arduino Uno can also produce a PWM signal, (short for pulse-width-modulated signal). This means it can very quickly (in the high kHz to MHz range) go from 0-5V with varying duty cycles (amount of time 0V compared to amount on 5V). This shows up on my oscilloscope as a square wave that changes the width of time high.
This signal is produced by the following code:
for (int iii=0; iii<256; iii++)
{
analogWrite(outuptPin, iii);
}
A PWM signal can mimic an analog voltage by providing the same average power, but it isn’t truly an analog value. 50% 0V and 50% 5V doesn’t equal 2.5V, especially if your sample rate is high.
So, now we face a problem: how do we get an analog voltage from pins that can only produce 0 or 5V? A device that does this is called a DAC (Digital to Analog Converter). One way is to use capacitors to “smooth” a PWM signal. The goal is to choose a capacitor sufficiently large such that it takes more time than the width of the pulse to charge or discharge. This will produce a voltage that is between 0 and 5V depending on the duty cycle, but is also fairly slow, because it needs to allow the capacitor to charge and change its voltage.
Step 2: R2R Circuit
Another option is to use a circuit composed of resistors connected in a particular way, called an R2R circuit. This is a very simple circuit that allows multiple binary signals to be converted into a single analog output.
Image from Wikipedia Page on R2R Resistor Ladder: shows the circuit diagram for an R2R circuit. It is called an R2R circuit because it only requires two arbitrary values of resistors; one simply needs to be twice the other. Thus, one is labeled R and the other two times R (2R).
One cool thing about this circuit is that you can make any voltage you want, and your precision goes up the more pins you go up. As you count up in binary (000, 001, 010, 011, 100, etc). The voltage produced at point A will correspondingly change. It worked really well for my project because:
- It’s fast: very little delay
- Easy to make: you only need two values of resistor (or one if you use two of the same in series where 2R goes) Cheap (because it is only made of resistors, which cost fractions of cents)
- Works well with Arduino: using the PORT functions you can quickly and easily write binary values to multiple pins at once, perfect for this application
Here’s a video (by GreatScott! on YouTube) that explains how this circuit works very well, using Thevenin’s superposition theorem to explain how to simplify the circuit:
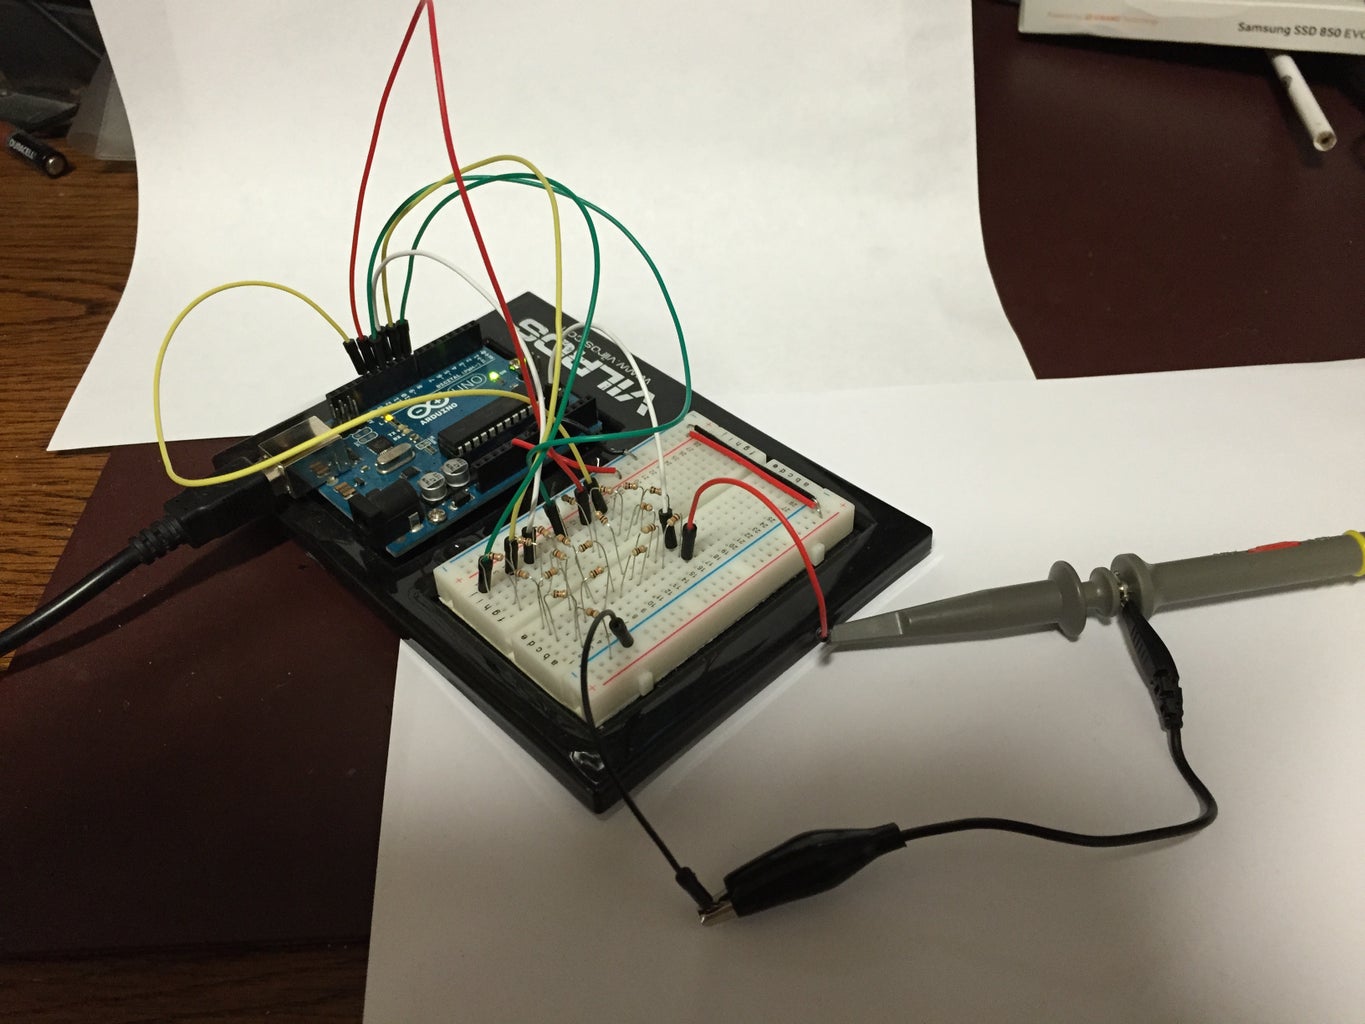
Step 3: Test the Circuit
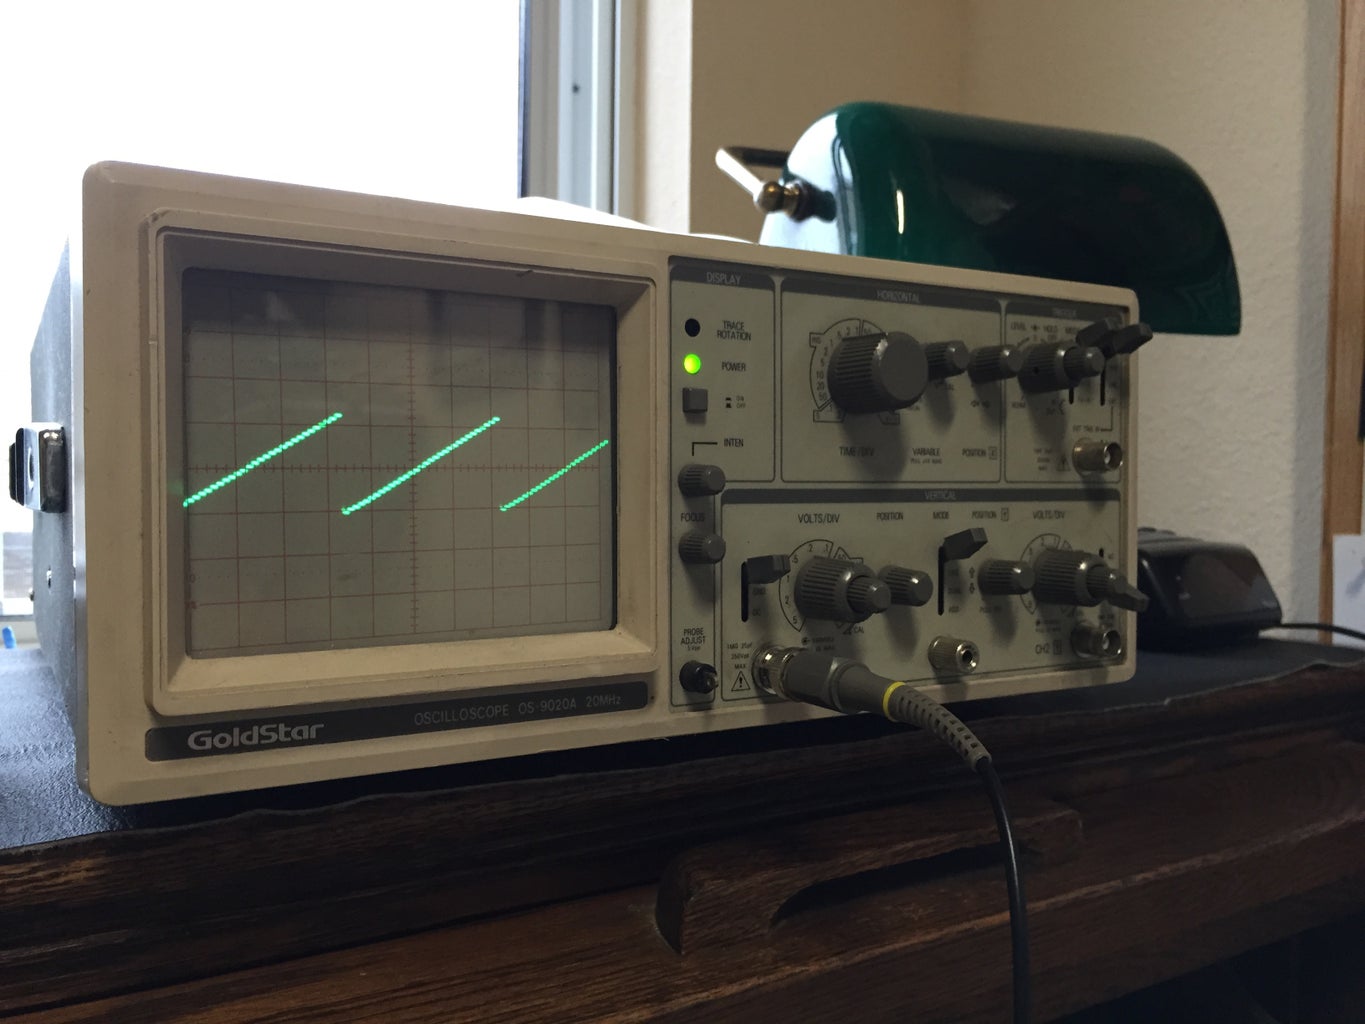
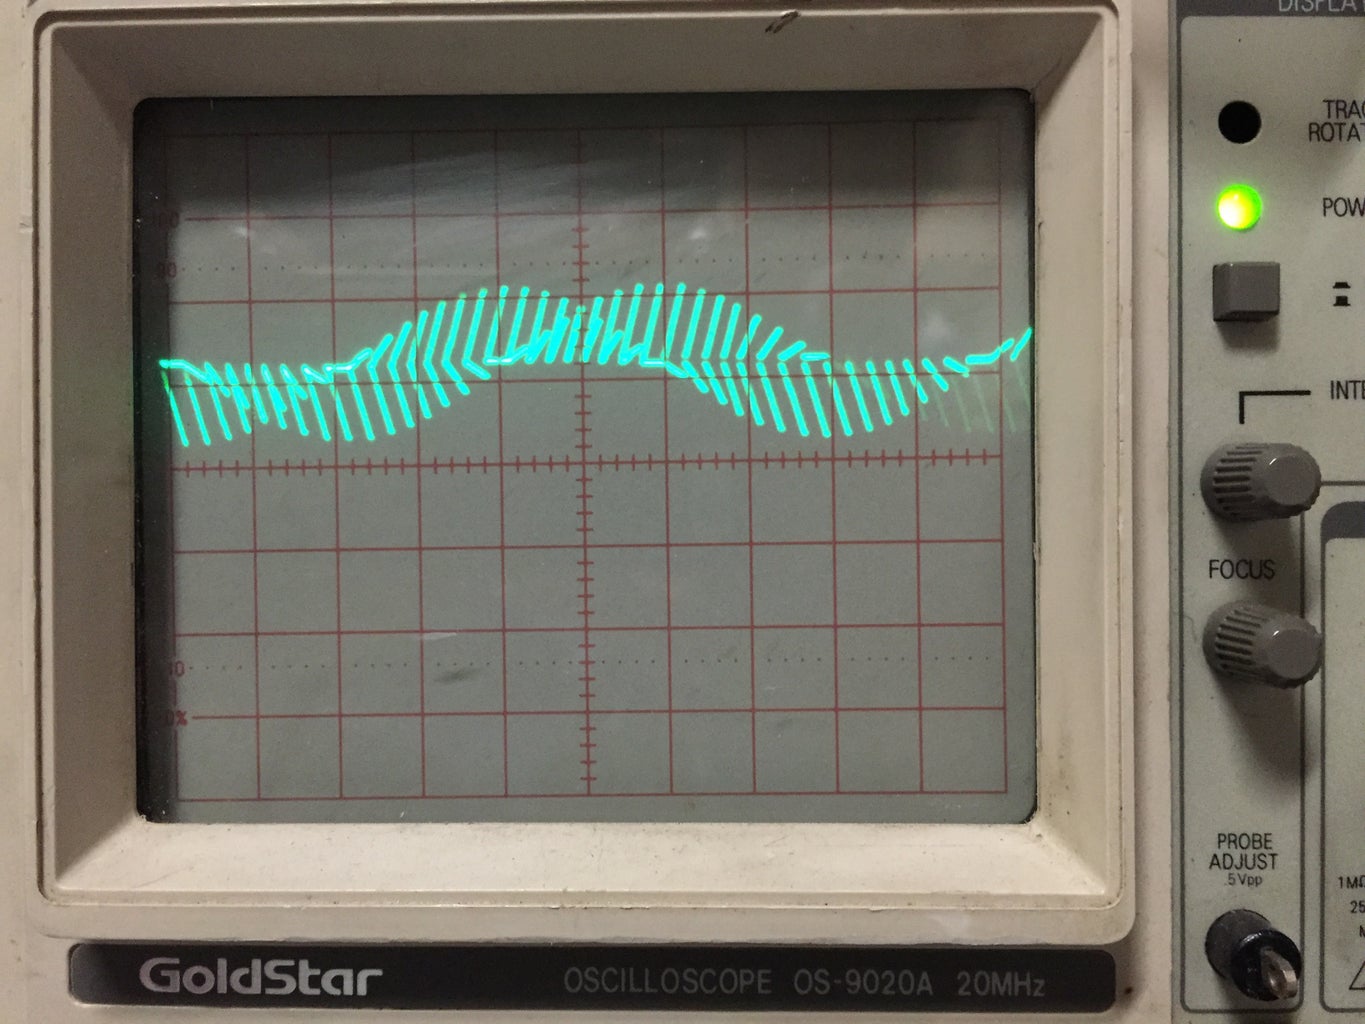
After building the circuit on a breadboard I started with simulating a ramp, as it is a simple changing signal that can I can easily visually inspect with my oscilloscope.
Success! The circuit works, and now I can create quickly changing analog values with my Arduino Uno and a simple circuit of resistors.
Step 4: Soldering the Circuit Together

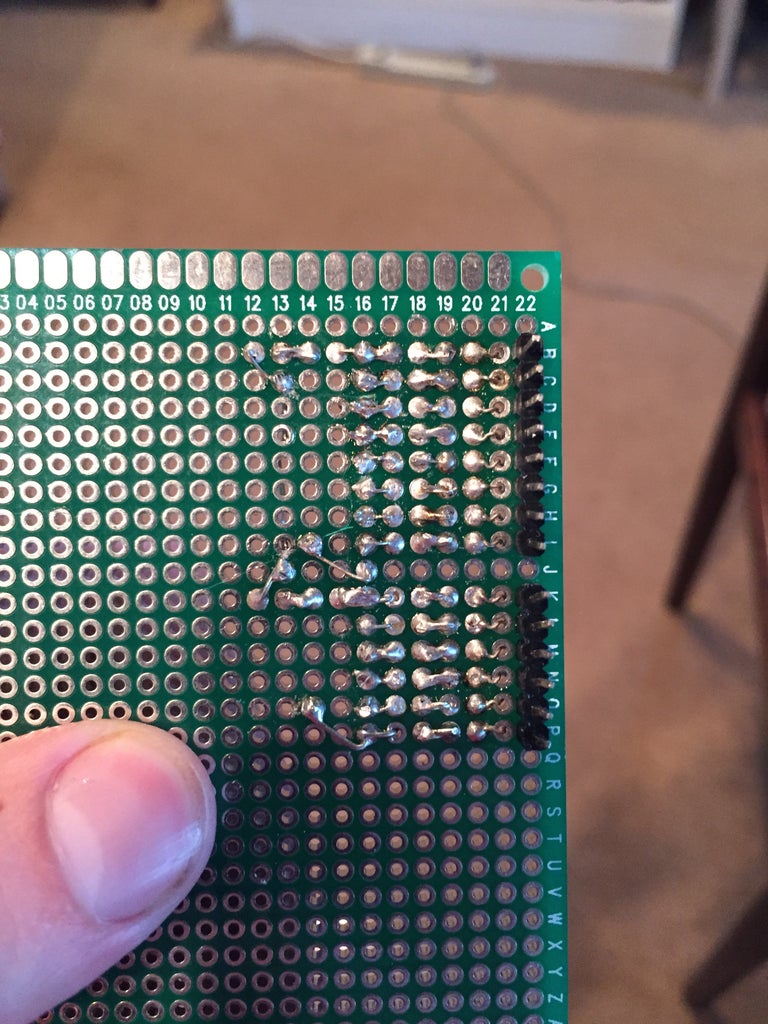
The back side of the board. I connected male pin headers, so I could plug it straight into the PORT registers of my UNO. Instead of using two values of one R and the other 2R Ohms, I connected two resistors of the same value in series to create an equivalent resistance of 2R.
Step 5: Creating Images
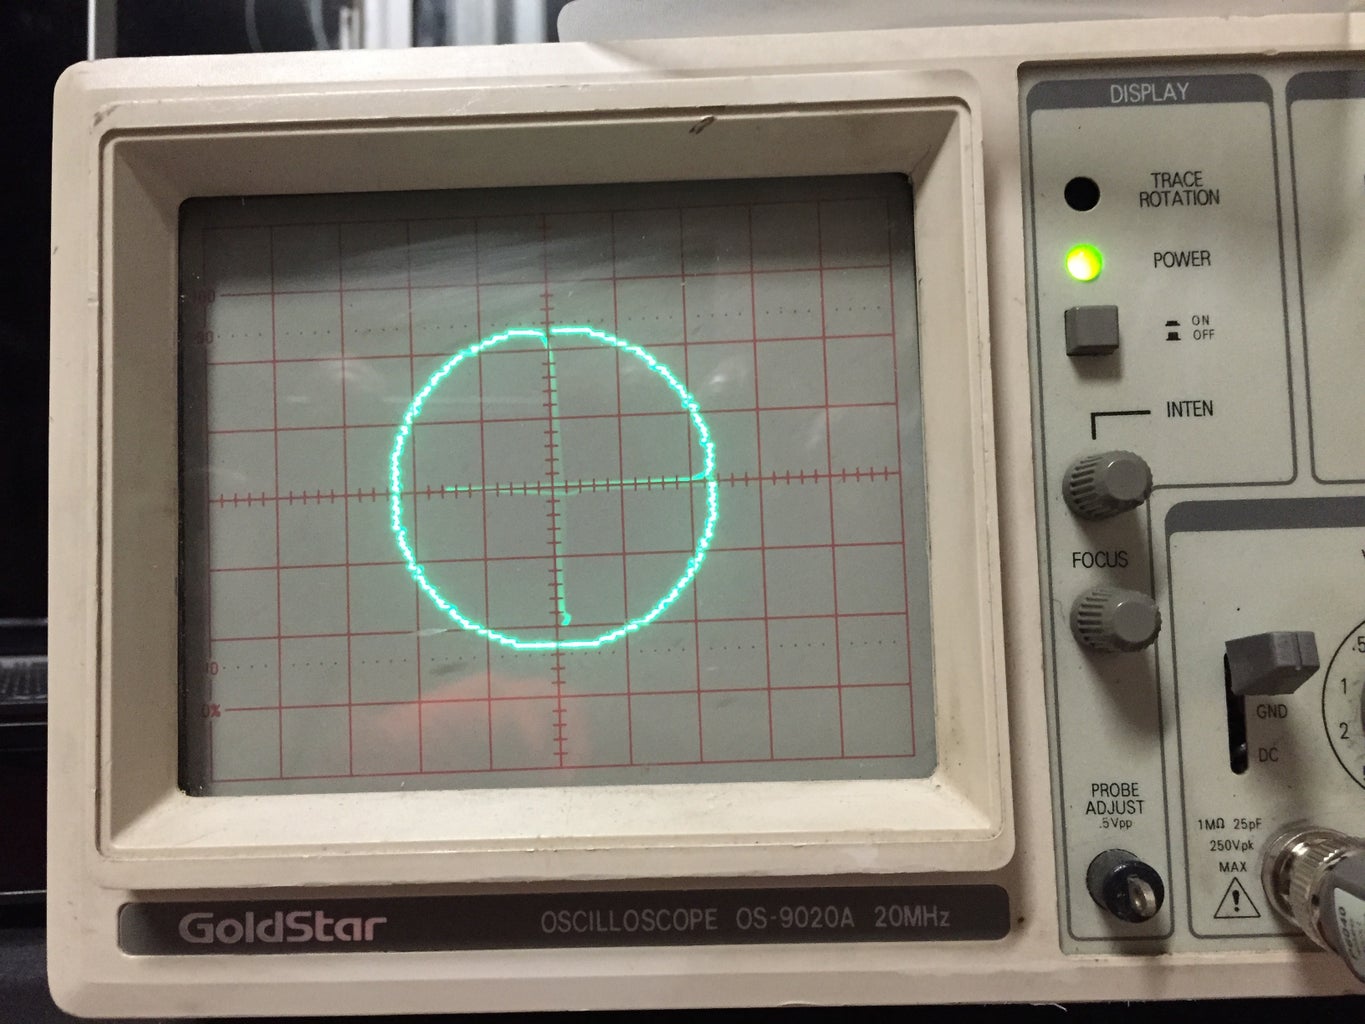
The next step is to use the new ability to quickly create analog voltages to create the image we want on the oscilloscope screen. With two R2R circuits (one on the UNO’s PORTB and the other on PORTD), we can create two independent voltages simultaneously. With the oscilloscope on X-Y mode, the voltage on probe 1 controls the x-position, and the voltage on probe 2 controls the y-position. Therefore, it becomes possible to make the display “draw” lines by incrementing each value.
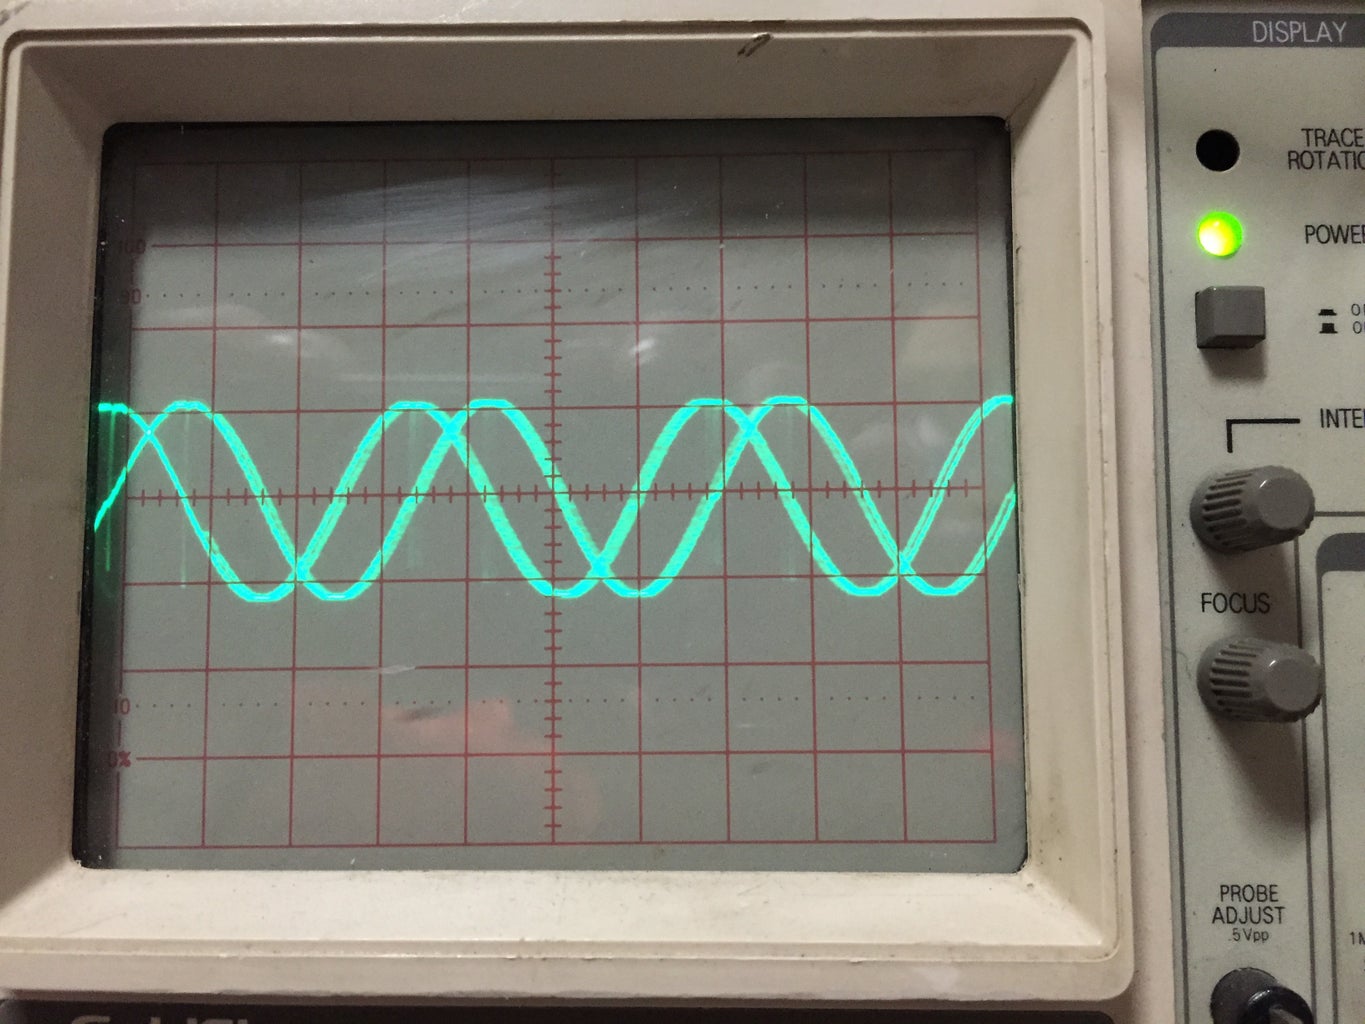
The first thing I displayed on my oscilloscope was a circle, because it is a simple combination of a sine and cosine wave. Here’s what each signal looks like. You can see the x and y component of the image, as two identical waves spaced 90 degrees apart.
Step 6: More Images
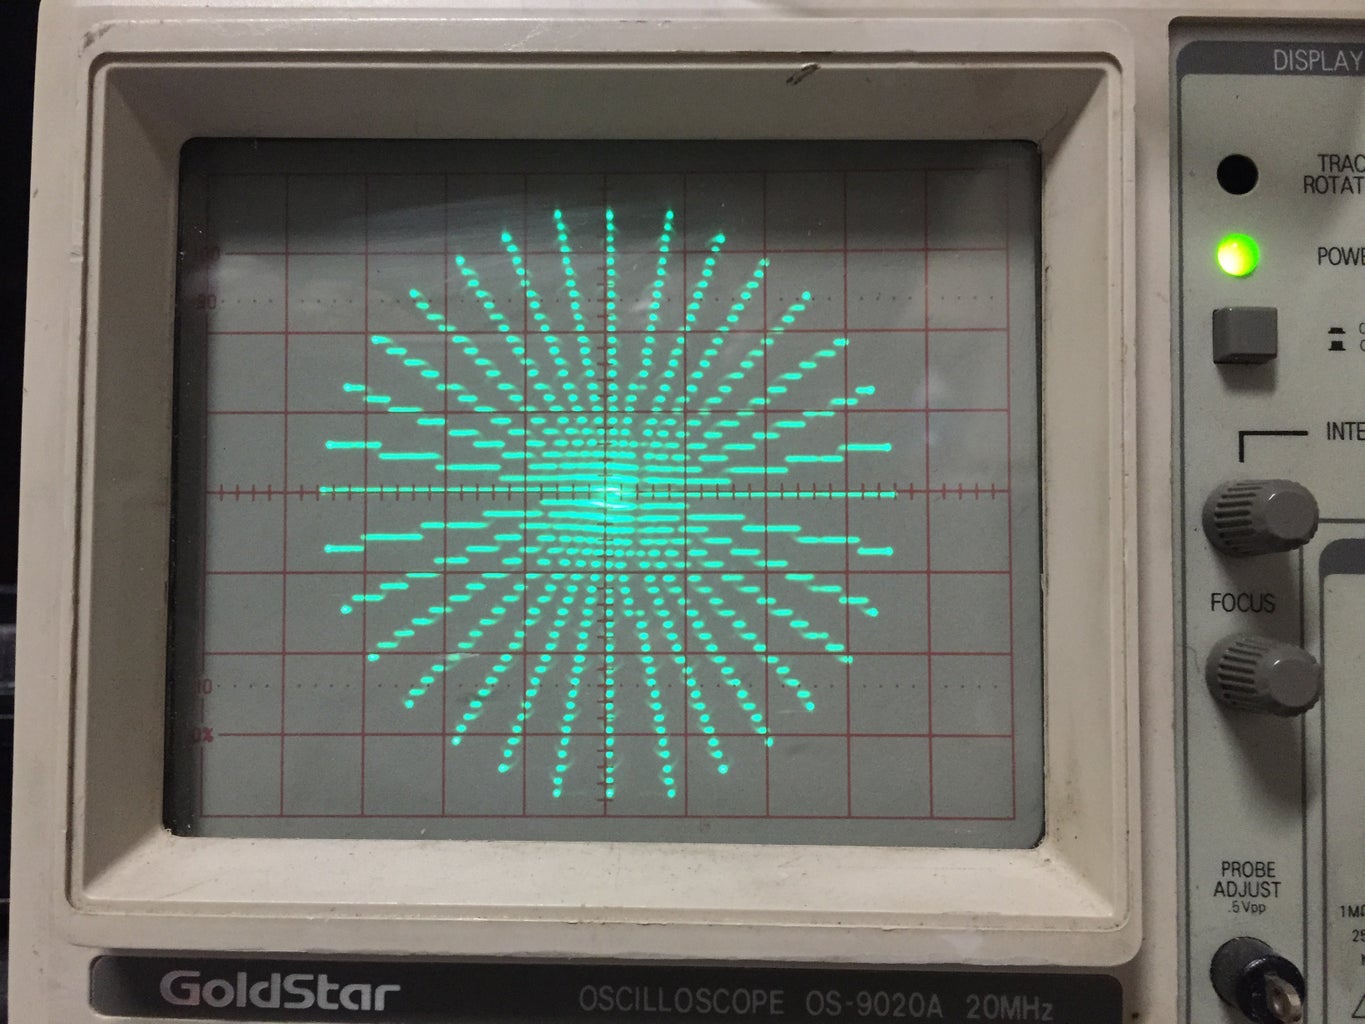
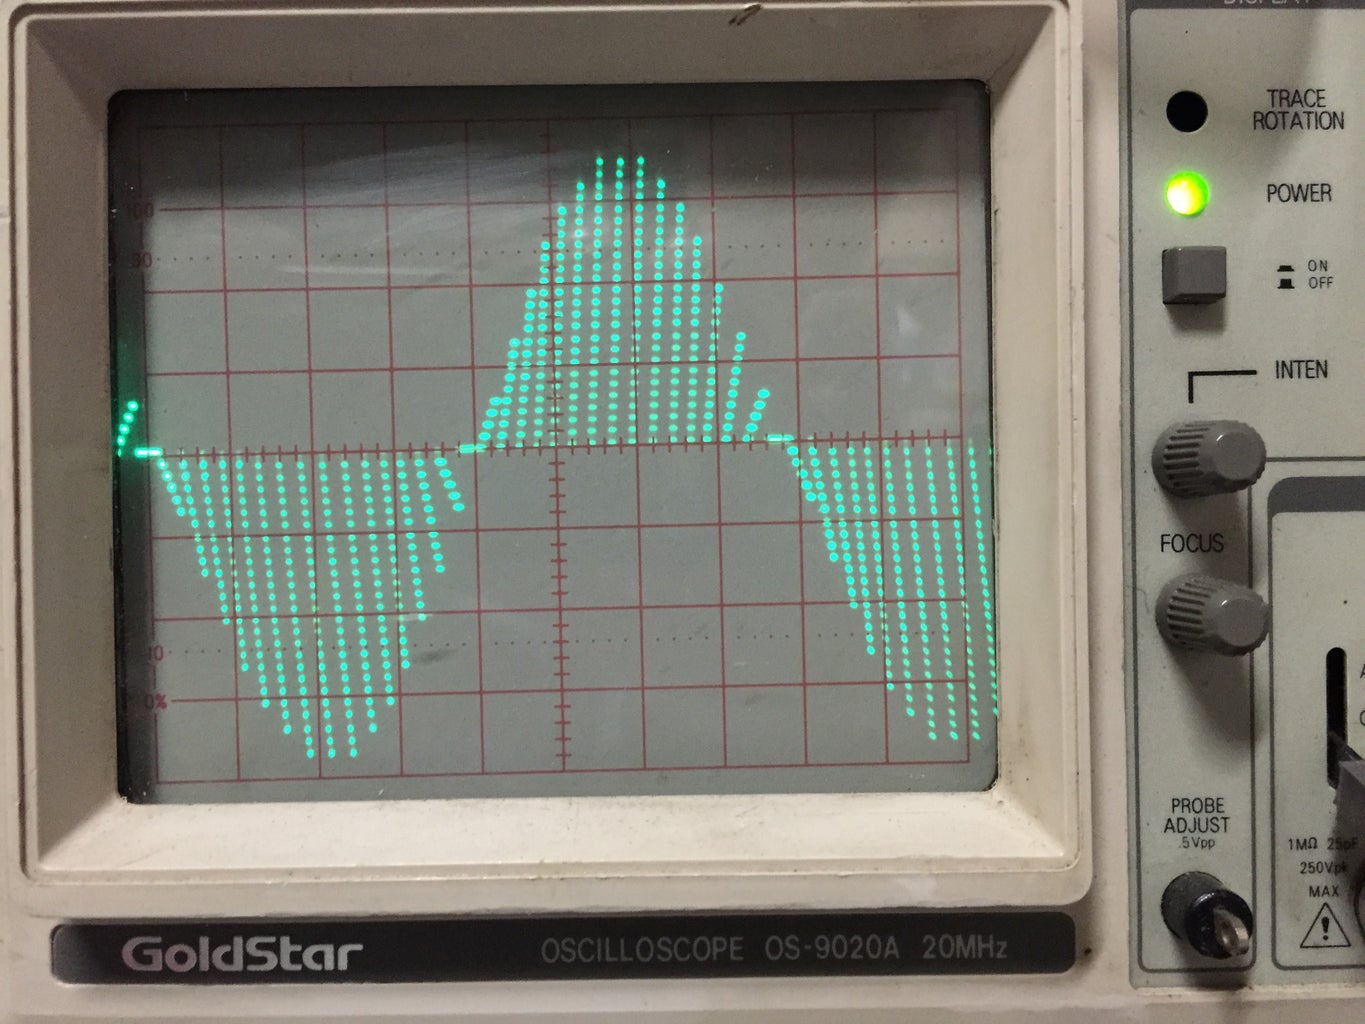
Here’s another test image, this time one of a starburst. This is basically made up of ramps of various slope with periodic amplitude.
Step 7: Drawing Vectors
We want to draw vectors on the display, so we can create an image out of points connected by lines. Basically, a connect-the-dots type of image.
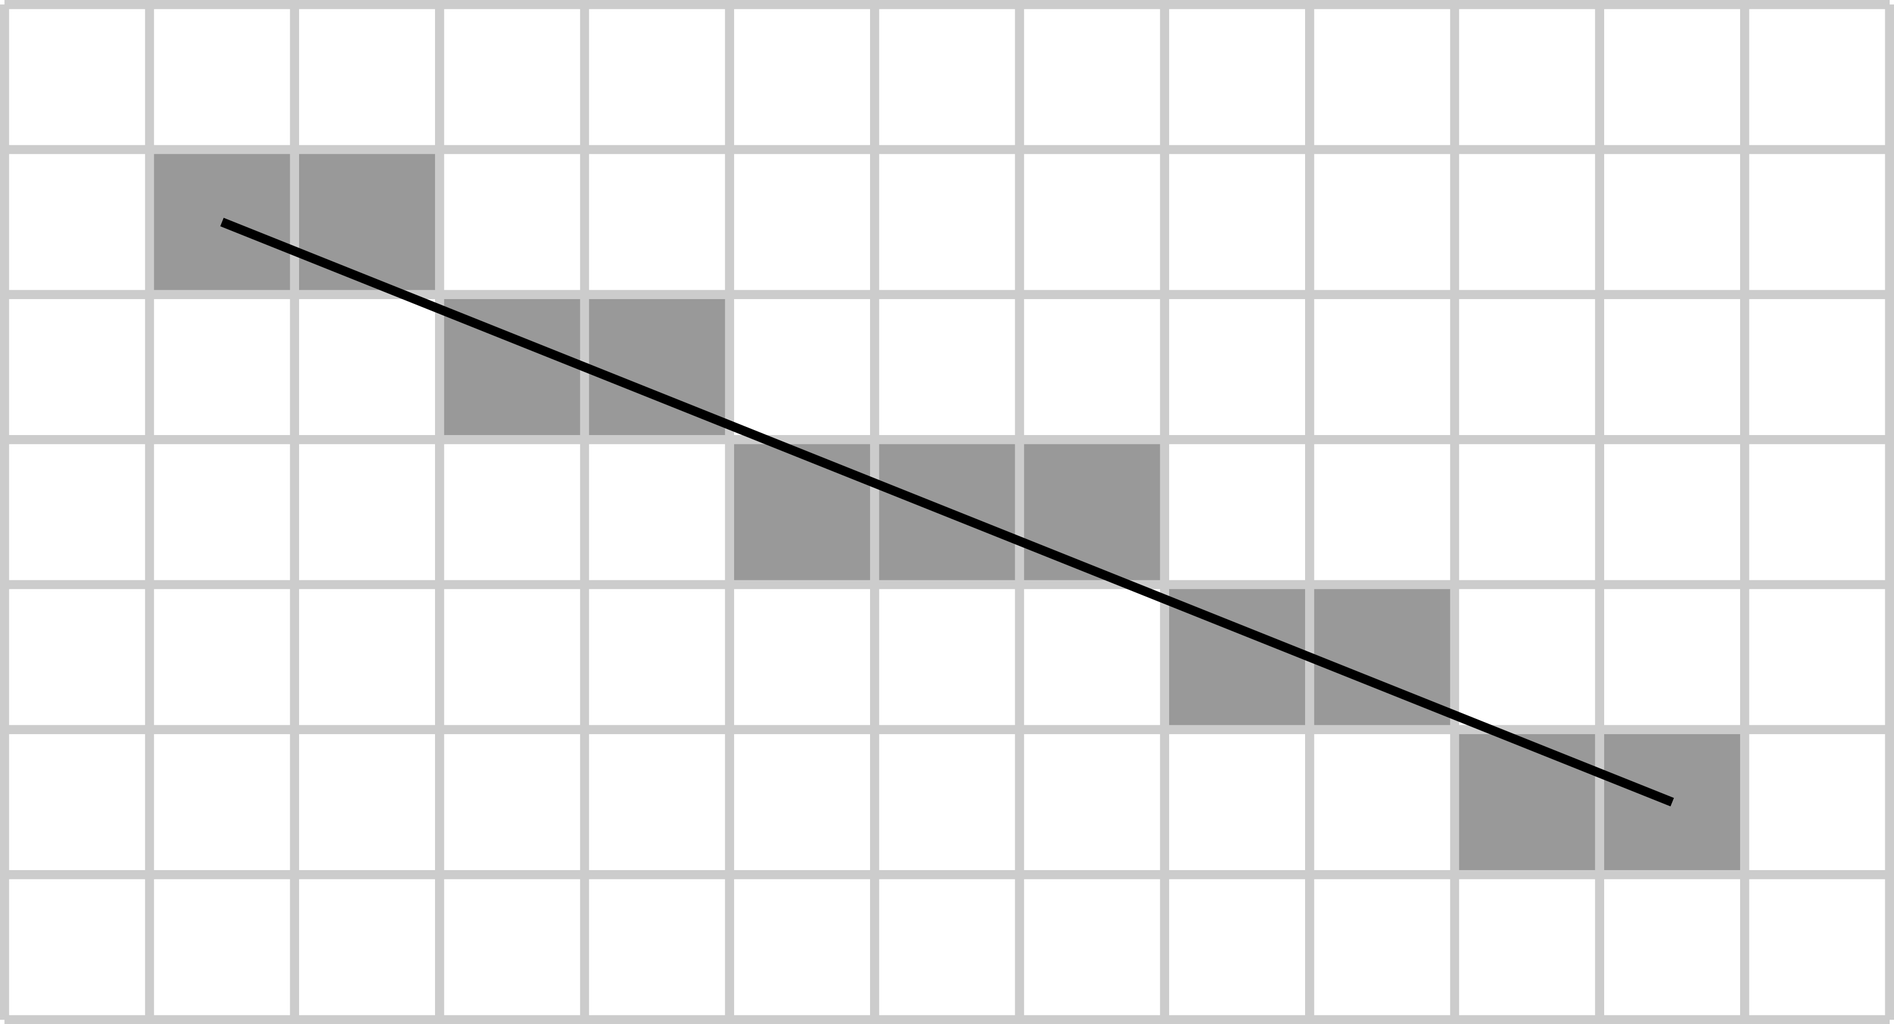
Because the DAC we have contains 256 discrete steps, we can’t technically make any “smooth” line. A way to work within these constraints is common in computer graphics applications, as pixels (discrete steps on a screen) often need to represent vector-based graphics. The code I’m using employs Bresenham’s line drawing algorithm to create a line between two given points with the function line() which has inputs of x1, y1, x2, and y2, as the start and end points of the vector.
The image above shows how it efficiently draws pixels in appropriate locations to display vectors within a pixel grid. And that’s the main idea of the code. With the coordinates of each vertex of an image, the code runs through each point and draws vectors between each point.
Step 8: Making a Design
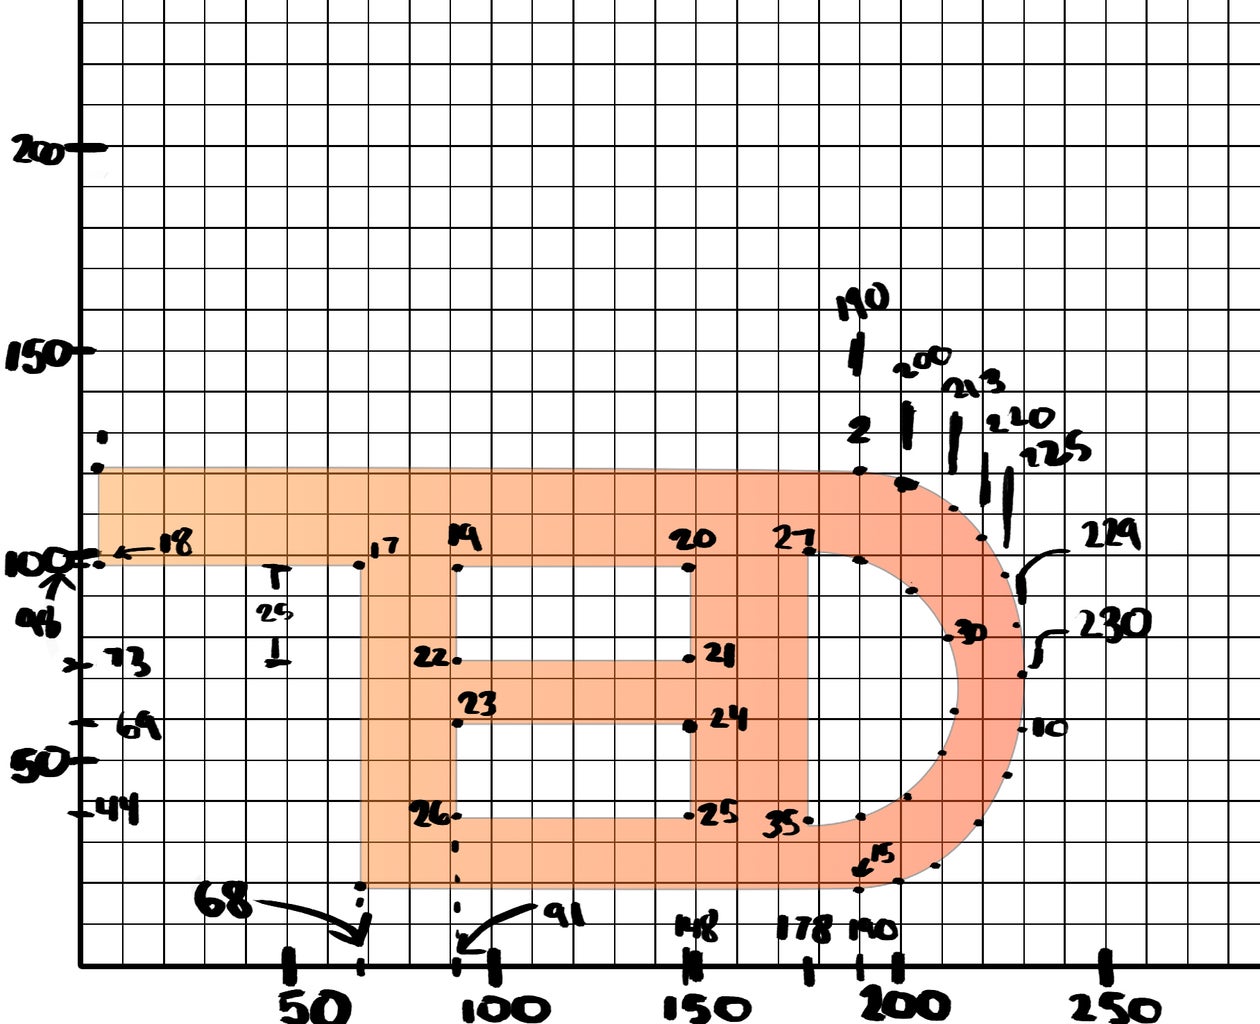
I started with the image of a logo I made a decade or so ago, the TED logo shown above. I then plotted a points to represent it with straight lines, within a 0 to 255 grid (because we have 256 steps of resolution).
Finally, I wrote down all these points and loaded them into an array that is programmed into the Arduino Uno.
Now if we want the logo to “spin”, the x-coordinates are changed in a periodic sinusoidal fashion to compress into a center line. If you want to see more information about how to do what I have described here, I recommend you watch the following video:
It was from this youtube video that I was inspired to mimic the idea of using an R2R circuit to create spinning graphics, and I am thankful for all of the interesting things I have learned along the way.
Step 9: Credit and Links
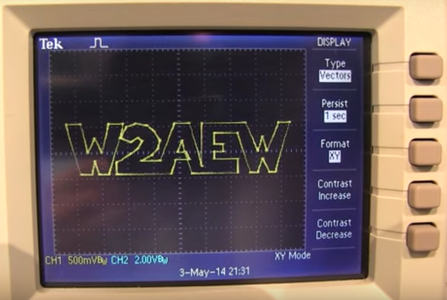
I'd like to thank w2aew, where I learned this idea and where he implemented it very well and continues to make great electronics videos. Check out the their videos here: https://www.youtube.com/user/w2aew/featured
and the oscilloscope graphics image here: https://www.youtube.com/watch?v=344oEu9vo7w
I also wrote a blog post about the same project at the following link:: https://tedfmyers.com/2015/10/06/r2r-dac-for-oscilloscope-graphics/
Thanks for reading my project, and post in the comments of anything you've drawn on your oscilloscope!

Participated in the
Makerspace Contest


