

Introduction: Online Graphs Using Nothing But an Arduino, Ethernet Shield, and Sensor


I've finally decided to put some of my existing projects up on instructables. This one is adapted from my Super Graphing Data Logger project.
What is the Super Graphing Data Logger (SGDL)? It is an Arduino project that integrates data logging and the graphing of this data online using little more than an Arduino with the appropriate shields and sensors. It differs from similar projects in that it doesn’t require a separate server or system to collect the data or to run script for the actual plot. Between the Arduino and the user’s browser, everything is taken care of.
Some time back I came across this neat javaScript based library for plotting and graphing called Highcharts JS. It didn’t take long for me to realize that charting with javaScript is very convenient for projects in which the server is limited in it’s capabilities, such as when using an Arduino with the Ethernet shield. Since the user’s browser does all the heavy lifting, the Arduino only needs to serve the files which is something it is perfectly capable of. This is especially true now that the Ethernet and SD libraries included in 1.0 support opening of multiple files simultaneously amongst other things. Thus the use of Highcharts allows us to create beautiful interactive charts based on data logged by the Arduino using nothing but the Arduino (and your browser, and a public javaScript CDN).
To replicate this project, a few things are necessary:
- An Arduino capable of connecting over Ethernet and storing files on an SD card. I used an Uno with the Ethernet shield. Presumably an Arduino Ethernet model will also work fine,and for the more adventurous, it may be possible to adapt my code to achieve the same functionality using a Wifi shield.
- Some sort of sensor or data source. For my project I chose to use a very cheap photoresistor.
Step 1: Sensor Assembly


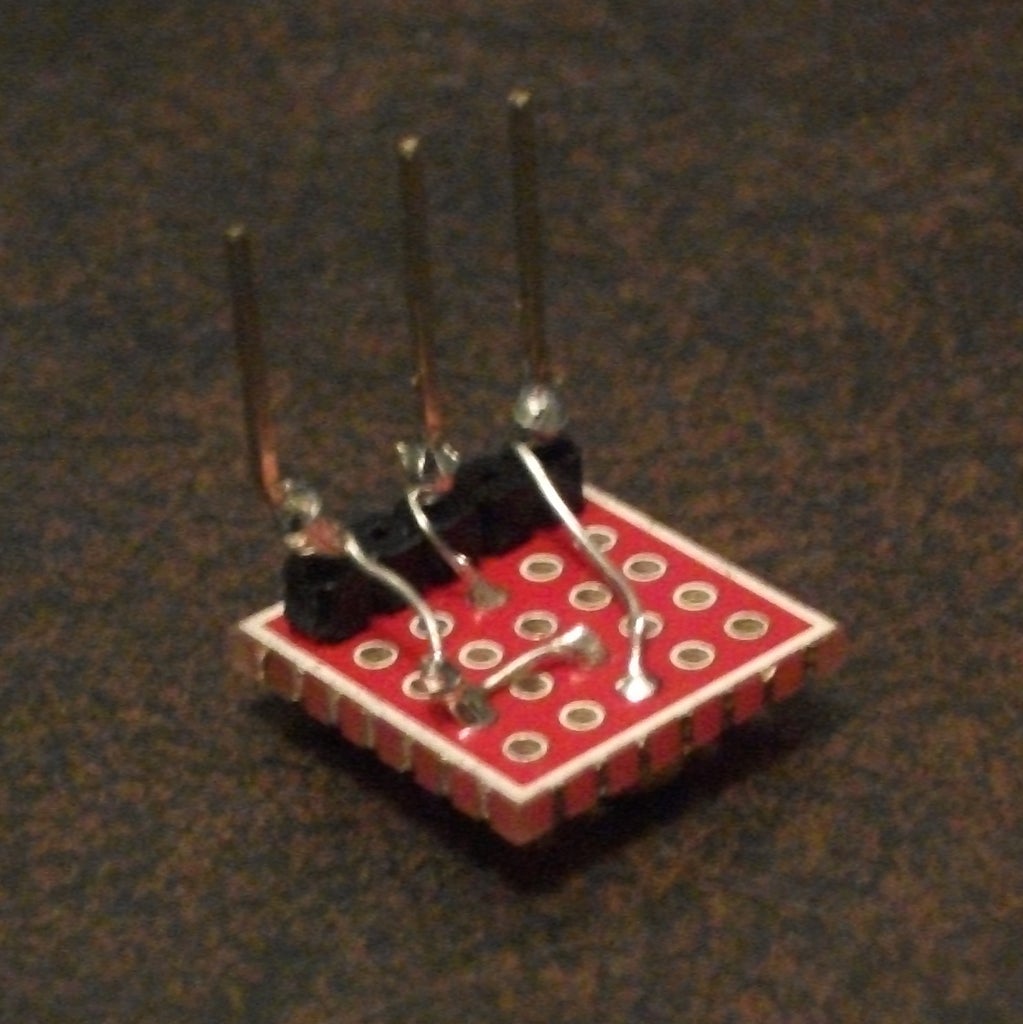

The light sensor is just a cheap photoresistor that I rigged up on a small perf board to plug directly into the 5v, gnd, and A0 pins of my Arduino (or more precisely, the headers on the Ethernet shield). It is set up in such a way that the minimum recordable light intensity is zero, while the maximum is 1024.
The pins on the male headers don’t quite line up, so I intentionally used extra long ones and added a slight S-curve to the one that goes to A0. This can be seen in better detail above. For those who are interested, the circuit is very simple, and a schematic can be seen in the last image, or the actual layout can be seen in the second last.
Step 2: SD Card Preparations

Before we get started, we need to make sure our SD card is good to go. It should be formatted as a FAT16 or FAT32 filesystem, the details of which are available on the official Arduino website. Once that is done, we need to ensure two things are present in the root directory of the card: the HC.htm file, and a data/ directory for our datafiles. The data directory is easily made with the same computer that was used to format the card provided one has an SD card reader of some sort. The HC.htm simply consists of the following code:
<!DOCTYPE HTML>
<html>
    <head>
        <meta http-equiv="Content-Type" content="text/html; charset=utf-8">
        <title>Super Graphing Data Logger!</title>

        <script type="text/javascript" src="http://ajax.googleapis.com/ajax/libs/jquery/1.8.2/jquery.min.js"></script>
        <script type="text/javascript">
function getDataFilename(str){
    point = str.lastIndexOf("file=")+4;

    tempString = str.substring(point+1,str.length)
    if (tempString.indexOf("&") == -1){
    return(tempString);
    }
    else{
        return tempString.substring(0,tempString.indexOf("&"));
    }

}

query  = window.location.search;

var dataFilePath = "/data/"+getDataFilename(query);

$(function () {
    var chart;
    $(document).ready(function() {

        // define the options
        var options = {

            chart: {
                renderTo: 'container',
                zoomType: 'x',
                spacingRight: 20
            },

            title: {
                text: 'Light levels recorded by the Arduino'
            },

            subtitle: {
                text: 'Click and drag in the plot area to zoom in'
            },

            xAxis: {
                type: 'datetime',
                maxZoom: 2 * 3600000
            },

            yAxis: {
                title: {
                    text: 'Light Levels (0 - 1024)'
                },
                min: 0,
                startOnTick: false,
                showFirstLabel: false
            },

            legend: {
                enabled: false
            },

            tooltip: {
                formatter: function() {
                        return '<b>'+ this.series.name +'</b><br/>'+
                        Highcharts.dateFormat('%H:%M - %b %e, %Y', this.x) +': '+ this.y;
                }
            },

            plotOptions: {
                series: {
                    cursor: 'pointer',
                    lineWidth: 1.0,
                    point: {
                        events: {
                            click: function() {
                                hs.htmlExpand(null, {
                                    pageOrigin: {
                                        x: this.pageX,
                                        y: this.pageY
                                    },
                                    headingText: this.series.name,
                                    maincontentText: Highcharts.dateFormat('%H:%M - %b %e, %Y', this.x) +':<br/> '+
                                        this.y,
                                    width: 200
                                });
                            }
                        }
                    },
                }
            },

            series: [{
                name: 'Light Levels',
                marker: {
                    radius: 2
                }
            }]
        };


        // Load data asynchronously using jQuery. On success, add the data
        // to the options and initiate the chart.
        //  http://api.jquery.com/jQuery.get/

        jQuery.get(dataFilePath, null, function(csv, state, xhr) {
            var lines = [],
                date,

                // set up the two data series
                lightLevels = [];

            // inconsistency
            if (typeof csv !== 'string') {
                csv = xhr.responseText;
            }

            // split the data return into lines and parse them
            csv = csv.split(/\n/g);
            jQuery.each(csv, function(i, line) {

                // all data lines start with a double quote
                line = line.split(',');
                date = parseInt(line[0], 10)*1000;

                lightLevels.push([
                    date,
                    parseInt(line[1], 10)
                ]);

            });

            options.series[0].data = lightLevels;

            chart = new Highcharts.Chart(options);
        });
    });

});
        </script>
    </head>
    <body>
        <p style="text-align:center;">Please allow the chart to load, it may take up to 30 seconds </p>
        <hr/>
<script src="http://cdnjs.cloudflare.com/ajax/libs/highcharts/2.3.5/highcharts.js"></script>

<!-- Additional files for the Highslide popup effect -->
<script type="text/javascript" src="http://www.highcharts.com/highslide/highslide-full.min.js"></script>
<script type="text/javascript" src="http://www.highcharts.com/highslide/highslide.config.js" charset="utf-8"></script>
<link rel="stylesheet" type="text/css" href="http://www.highcharts.com/highslide/highslide.css" />

<div id="container" style="min-width: 400px; height: 400px; margin: 0 auto"></div>

    </body>
</html>
You will need to edit this file first to make sure it points towards the preferred location of your highcharts.js files. You can leave this as the public CDN: http://cdnjs.cloudflare.com/ajax/libs/highcharts/2.3.5/highcharts.js, change it to point towards your own webhost, or it can even be on the Arduino’s SD card (this will be slow). It is not necessary to create a datafile before hand, the SGDL sketch will take care of that when it decides to record its first data point. Before we get that far though, it is necessary to make sure we have configured the EEPROM memory for the SGDL sketch.
Step 3: EEPROM Configuration

Configuring the EEPROM for the first time is easily accomplished using the following sketch, which I have called EEPROM_config. This sketch (along with SGDL itself) requires an extra library called EEPROMAnything, which needs to be added to the Arduino’s libraries folder wherever one’s sketchbook folder is. While you’re at it, you should also add the Time library which we need for SGDL.
/* ************************************************************************
 * ***            Super Graphing Data Logger - EEPROM config            ***
 * ************************************************************************
 * Everett Robinson, December 2012.
 *
 * The following extra non standard libraries were used, and will need to be
 * added to the libraries folder:
 * - EEPROMAnything:  http://playground.arduino.cc/Code/EEPROMWriteAnyt...
 *
 * This sketch helps you set the values in EEPROM which are necessary for
 * Super Graphing Data Logger. It should only need the be run once before
 * the first time you set up SGDL, or in the unlikely event that the EEPROM
 * becomes corrupted.
 *
 * Please ensure that the values in configuration config are appropriate for
 * your project before uncommenting the EEPROM_writeAnything(0, config); line.
 *
 */

#include <EEPROM.h>
#include <EEPROMAnything.h>

typedef struct{
    unsigned long newFileTime;
    char workingFilename[19];
  } configuration;

//This is a one off thing, so everything is in setup
void setup(){
  Serial.begin(9600);

  //Create the config struct to write to EEPROM, change values as appropriate
  //Make sure your filename is not too long for the workingFilename char array
  configuration config = {1356912000L,"/data/25-12-12.csv"};
  //Write the values to the EEPROM
  //EEPROM_writeAnything(0, config);       //Uncomment when you're sure everything is correct
  configuration config2;                   //Create a second config struct for verification
  EEPROM_readAnything(0,config2);
  Serial.print("The value read from EEPROM for newFileTime is: ");
  Serial.println(config2.newFileTime);
  Serial.print("The value read from EEPROM for workingFilename is: ");
  Serial.println(config2.workingFilename);
  Serial.println("If those values are correct then everything went as planned. Otherwise,");
  Serial.println("please double check that the values declared for the struct config are");
  Serial.println("correct and that that EEPROM_writeAnything line is uncommented.");
}


void loop(){
}
I have intentionally commented out the write line so that no one writes junk to the EEPROM by accident. While the EEPROM has a life of ~100,000 write cycles, I’d rather not waste any of them. Please review the sketch carefully and ensure you’ve adjusted it accordingly before uploading it to the Arduino. The most important thing is to ensure that your newFileTime is something sensible (in the near future most of all).
Step 4: The Arduino Sketch

Now that that’s all taken care of, we’re ready to get SGDL all set up! The code will need a few adjustments for your own specific setup, mostly in regards to the Ethernet MAC and IP addresses. I trust that anyone making use of this code already knows how to configure their router to work with the Arduino, and that they can find the appropriate local IP address to update this sketch with. You may also wish to change the timeserver IP address to one that is geographically closer to yourself.
I currently have my code set up to make a measurement every 10 minutes, and to create a new data file every week. You are welcome to change those parameters, just be aware that the current data file management names files using a dd-mm-yy.csv date format, so the new file interval should be at least 24 hours. Another concern, is that the shorter the measurement interval and the longer the new data file interval is, the larger the files will be. Because the Arduino is not especially powerful, this will have consequences for the loading times of each chart.
/* ************************************************************************
 * ***                    Super Graphing Data Logger                    ***
 * ************************************************************************
 * Everett Robinson, December 2012. More at:  http://everettsprojects.com
 *
 * This sketch relies on the SD and ethernet libraries in arduino 1.0 or newer.
 * The following extra non standard libraries were also used, and will need to
 * be added to the libraries folder:
 * - Time:  http://everettsprojects.com
 * - EEPROMAnything:  http://everettsprojects.com
 *
 * If this is your first time setting up this project, please go get the
 * EEPROM_config sketch from  http://everettsprojects.com so that you can
 * configure the config struct in the EEPROM memory. Usage of the EEPROM
 * is needed to make the project resiliant against a temporary loss of power.
 *
 * You must also ensure that you have the HC.htm file in the root directory
 * of your SD card, as well as a data directory where the datafiles will be
 * stored.
 *
 * This sketch combines the functionality of an existing fileserver example
 * which can be found at  http://everettsprojects.com
 * with the Datalogger example that comes with the new SD library from 1.0,
 * as well as some code from the UdpNtpClient example that cones with the
 * ethernet library.
 *
 * Added to all of these are some tricks to make it manage and serve up the
 * datafiles in conjunction with a page which uses highcharts JS to graph it.
 * This is basically accomplished using the arduino by itself. Because I
 * actually host the highcharts.js files externally, this is true more in
 * theory than in actual practice, but oh well. It should work just fine to
 * have the highcharts.js file on the arduino's SD card, though loading the
 * page will be painfully slow.
 *
 * Some of the code this was derived from may or may not be under a GPL
 * licence; I'm not entirely sure. I suppose anyone using this should treat
 * it like it is too, but I don't really care too much.
 * Also if one intends to use this for commercial applications, it may be
 * necessary to purchase a license for Highcharts.
 *
 * Changes:   -------------------------------------------------------------
 * January 2013: Updated so that the dd-mm-yy.csv file format is properly
 * followed, all single digit days, months, and years will have a leading
 * zero now.
 *
 */

#include <sd.h>
#include <ethernet.h>
#include <ethernetudp.h>
#include <spi.h>
#include <string.h>
#include <time.h>
#include <eeprom.h>
#include <eepromanything.h>
#include <avr/pgmspace.h>

/************ ETHERNET STUFF ************/
byte mac[] = { 0x90, 0xA2, 0xDA, 0x00, 0x4C, 0x64 };
byte ip[] = { 192,168,1, 100 };
EthernetServer server(80);

/************** NTP STUFF ***************/
unsigned int localPort = 8888;          // local port to listen for UDP packets
IPAddress timeServer(132, 163, 4, 101); //NIST time server IP address: for more info
                                        //see  http://everettsprojects.com


const int NTP_PACKET_SIZE= 48; //NTP time stamp is in the first 48 bytes of the message
byte packetBuffer[ NTP_PACKET_SIZE]; //buffer to hold incoming and outgoing packets
EthernetUDP Udp;

/*** DATA LOGGER AND TIMER CONTROLS ****/
const int analogPin = 0;
unsigned long lastIntervalTime = 0; //The time the last measurement occured.
#define MEASURE_INTERVAL 600000     //10 minute intervals between measurements (in ms)
unsigned long newFileTime;          //The time at which we should create a new week's file
#define FILE_INTERVAL 604800        //One week worth of seconds

//A structure that stores file config variables from EEPROM
typedef struct{
    unsigned long newFileTime;      //Keeps track of when a newfile should be made.
    char workingFilename[19];       //The path and filename of the current week's file
} configuration;

configuration config;               //Actually make our config struct


// Strings stored in flash mem for the Html Header (saves ram)
prog_char HeaderOK_0[] PROGMEM = "HTTP/1.1 200 OK";            //
prog_char HeaderOK_1[] PROGMEM = "Content-Type: text/html";    //
prog_char HeaderOK_2[] PROGMEM = "";                           //

// A table of pointers to the flash memory strings for the header
PROGMEM const char *HeaderOK_table[] = {
  HeaderOK_0,
  HeaderOK_1,
  HeaderOK_2
};

// A function for easy printing of the headers
void HtmlHeaderOK(EthernetClient client) {

    char buffer[30]; //A character array to hold the strings from the flash mem

    for (int i = 0; i < 3; i++) {
      strcpy_P(buffer, (char*)pgm_read_word(&(HeaderOK_table[i])));
      client.println( buffer );
    }
}


// Strings stored in flash mem for the Html 404 Header
prog_char Header404_0[] PROGMEM = "HTTP/1.1 404 Not Found";     //
prog_char Header404_1[] PROGMEM = "Content-Type: text/html";    //
prog_char Header404_2[] PROGMEM = "";                           //
prog_char Header404_3[] PROGMEM = "<h2>File Not Found!</h2>";

// A table of pointers to the flash memory strings for the header
PROGMEM const char *Header404_table[] = {
  Header404_0,
  Header404_1,
  Header404_2,
  Header404_3
};

// Easy peasy 404 header function
void HtmlHeader404(EthernetClient client) {

    char buffer[30]; //A character array to hold the strings from the flash mem

    for (int i = 0; i < 4; i++) {
      strcpy_P(buffer, (char*)pgm_read_word(&(Header404_table[i])));
      client.println( buffer );
    }
}


void setup() {
  Serial.begin(9600);

  pinMode(10, OUTPUT);          // set the SS pin as an output (necessary!)
  digitalWrite(10, HIGH);       // but turn off the W5100 chip!

  // see if the card is present and can be initialized:
  if (!SD.begin(4)) {
    Serial.println("Card failed, or not present");
    // don't do anything more:
    return;
  }
  Serial.println("card initialized.");

  // The SD card is working, start the server and ethernet related stuff!
  Ethernet.begin(mac, ip);
  server.begin();
  Udp.begin(localPort);
  EEPROM_readAnything(0,config); // make sure our config struct is syncd with EEPROM
}


// A function that takes care of the listing of files for the
// main page one sees when they first connect to the arduino.
// it only lists the files in the /data/ folder. Make sure this
// exists on your SD card.
void ListFiles(EthernetClient client) {

  File workingDir = SD.open("/data");

  client.println("<ul>");

    while(true) {
      File entry =  workingDir.openNextFile();
       if (! entry) {
         break;
       }
       client.print("<li><a href="\"/HC.htm?file=");
       client.print(entry.name());
       client.print("\">");
       client.print(entry.name());
       client.println("</a></li>");
       entry.close();
    }
  client.println("</ul>");
  workingDir.close();
}

// A function to get the Ntp Time. This is used to make sure that the data
// points recorded by the arduino are referenced to some meaningful time
// which in our case is UTC represented as unix time (choosen because it
// works simply with highcharts without too much unecessary computation).
unsigned long getTime(){
  sendNTPpacket(timeServer); // send an NTP packet to a time server

  // wait to see if a reply is available
  delay(1000);
  if ( Udp.parsePacket() ) {
    // We've received a packet, read the data from it
    Udp.read(packetBuffer,NTP_PACKET_SIZE);  // read the packet into the buffer

    //the timestamp starts at byte 40 of the received packet and is four bytes,
    // or two words, long. First, esxtract the two words:

    unsigned long highWord = word(packetBuffer[40], packetBuffer[41]);
    unsigned long lowWord = word(packetBuffer[42], packetBuffer[43]);
    // combine the four bytes (two words) into a long integer
    // this is NTP time (seconds since Jan 1 1900):
    unsigned long secsSince1900 = highWord << 16 | lowWord;
    // Unix time starts on Jan 1 1970. In seconds, that's 2208988800:
    const unsigned long seventyYears = 2208988800UL;
    // subtract seventy years:
    unsigned long epoch = secsSince1900 - seventyYears;
    // return Unix time:
    return epoch;
  }
}

// send an NTP request to the time server at the given address,
// necessary for getTime().
unsigned long sendNTPpacket(IPAddress& address){

  // set all bytes in the buffer to 0
  memset(packetBuffer, 0, NTP_PACKET_SIZE);
  // Initialize values needed to form NTP request
  // (see URL above for details on the packets)
  packetBuffer[0] = 0b11100011;   // LI, Version, Mode
  packetBuffer[1] = 0;     // Stratum, or type of clock
  packetBuffer[2] = 6;     // Polling Interval
  packetBuffer[3] = 0xEC;  // Peer Clock Precision
  // 8 bytes of zero for Root Delay & Root Dispersion
  packetBuffer[12]  = 49;
  packetBuffer[13]  = 0x4E;
  packetBuffer[14]  = 49;
  packetBuffer[15]  = 52;

  // all NTP fields have been given values, now
  // you can send a packet requesting a timestamp:
  Udp.beginPacket(address, 123); //NTP requests are to port 123
  Udp.write(packetBuffer,NTP_PACKET_SIZE);
  Udp.endPacket();
}


// How big our line buffer should be for sending the files over the ethernet.
// 75 has worked fine for me so far.
#define BUFSIZ 75

void loop(){
  if ((millis() % lastIntervalTime) >= MEASURE_INTERVAL){ //Is it time for a new measurement?

    char dataString[20] = "";
    int count = 0;
    unsigned long rawTime;
    rawTime = getTime();

    while((rawTime == 39) && (count < 12)){     //server seems to send 39 as an error code
      delay(5000);                              //we want to retry if this happens. I chose
      rawTime = getTime();                      //12 retries because I'm stubborn/persistent.
      count += 1;                               //NIST considers retry interval of <4s as DoS
    }                                           //attack, so fair warning.

    if (rawTime != 39){                         //If that worked, and we have a real time

      //Decide if it's time to make a new file or not. Files are broken
      //up like this to keep loading times for each chart bearable.
      //Lots of string stuff happens to make a new filename if necessary.
      if (rawTime >= config.newFileTime){
        int dayInt = day(rawTime);
        int monthInt = month(rawTime);
        int yearInt = year(rawTime);
        char newFilename[18] = "";
        char dayStr[3];
        char monthStr[3];
        char yearStr[5];
        char subYear[3];
        strcat(newFilename,"data/");
        itoa(dayInt,dayStr,10);
        if (dayInt < 10){
          strcat(newFilename,"0");
        }
        strcat(newFilename,dayStr);
        strcat(newFilename,"-");
        itoa(monthInt,monthStr,10);
        if (monthInt < 10){
          strcat(newFilename,"0");
        }
        strcat(newFilename,monthStr);
        strcat(newFilename,"-");
        itoa(yearInt,yearStr,10);
        //we only want the last two digits of the year
        memcpy( subYear, &yearStr[2], 3 );
        strcat(newFilename,subYear);
        strcat(newFilename,".csv");

        //make sure we update our config variables:
        config.newFileTime += FILE_INTERVAL;
        strcpy(config.workingFilename,newFilename);
        //Write the changes to EEPROM. Bad things may happen if power is lost midway through,
        //but it's a small risk we take. Manual fix with EEPROM_config sketch can correct it.
        EEPROM_writeAnything(0, config);
      }

      //get the values and setup the string we want to write to the file
      int sensor = analogRead(analogPin);
      char timeStr[12];
      char sensorStr[6];

      ultoa(rawTime,timeStr,10);
      itoa(sensor,sensorStr,10);

      strcat(dataString,timeStr);
      strcat(dataString,",");
      strcat(dataString,sensorStr);

      //open the file we'll be writing to.
      File dataFile = SD.open(config.workingFilename, FILE_WRITE);

      // if the file is available, write to it:
      if (dataFile) {
        dataFile.println(dataString);
        dataFile.close();
        // print to the serial port too:
        Serial.println(dataString);
      }
      // if the file isn't open, pop up an error:
      else {
        Serial.println("Error opening datafile for writing");
      }
    }
    else{
      Serial.println("Couldn't resolve a time from the Ntp Server.");
    }
    //Update the time of the last measurment to the current timer value
    lastIntervalTime = millis();
  }
  //No measurements to be made, make sure the webserver is available for connections.
  else{
    char clientline[BUFSIZ];
    int index = 0;

    EthernetClient client = server.available();
    if (client) {
      // an http request ends with a blank line
      boolean current_line_is_blank = true;

      // reset the input buffer
      index = 0;

      while (client.connected()) {
        if (client.available()) {
          char c = client.read();

          // If it isn't a new line, add the character to the buffer
          if (c != '\n' && c != '\r') {
            clientline[index] = c;
            index++;
            // are we too big for the buffer? start tossing out data
            if (index >= BUFSIZ)
              index = BUFSIZ -1;

            // continue to read more data!
            continue;
          }

          // got a \n or \r new line, which means the string is done
          clientline[index] = 0;

          // Print it out for debugging
          Serial.println(clientline);

          // Look for substring such as a request to get the root file
          if (strstr(clientline, "GET / ") != 0) {
            // send a standard http response header
            HtmlHeaderOK(client);
            // print all the data files, use a helper to keep it clean
            client.println("<h2>View data for the week of (dd-mm-yy):</h2>");
            ListFiles(client);
          }
          else if (strstr(clientline, "GET /") != 0) {
            // this time no space after the /, so a sub-file!
            char *filename;

            filename = strtok(clientline + 5, "?"); // look after the "GET /" (5 chars) but before
            // the "?" if a data file has been specified. A little trick, look for the " HTTP/1.1"
            // string and turn the first character of the substring into a 0 to clear it out.
            (strstr(clientline, " HTTP"))[0] = 0;

            // print the file we want
            Serial.println(filename);
            File file = SD.open(filename,FILE_READ);
            if (!file) {
              HtmlHeader404(client);
              break;
            }

            Serial.println("Opened!");

            HtmlHeaderOK(client);

            int16_t c;
            while ((c = file.read()) > 0) {
                // uncomment the serial to debug (slow!)
                //Serial.print((char)c);
                client.print((char)c);
            }
            file.close();
          }
          else {
            // everything else is a 404
            HtmlHeader404(client);
          }
          break;
        }
      }
      // give the web browser time to receive the data
      delay(1);
      client.stop();
    }
  }
}
Step 5: The Results


The best way to appreciate the final product is to actually play with it. While I’m not going to open up my home network and Arduino to the big wide internet, I have mirrored the pages and datafiles it produces on a webhost. These won’t be updated with new datapoints like the actual Arduino version will be, but they should at least give a fair impression of how the project looks and feels without the need to actually implement it.
Going to the above page, we see that we are presented with a very basic list of the data files that can be selected from. Clicking any of them will cause the graph for that datafile to be loaded (much more quickly than the Arduino can manage).
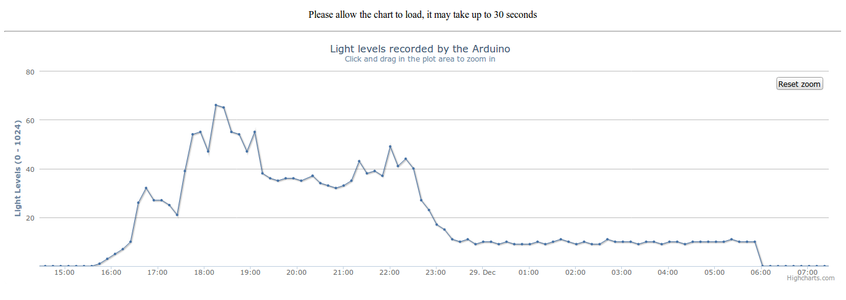
This chart for the 25-12-12.CSV file is already complete, and won’t have any new data added to it in the future, because the files for subsequent weeks have already been made. There is a lot to see though. The two data points that are at 1000 on the y-axis are from when I pointed a bright flashlight directly at the photo sensor. All of the data points between 300 and 400 on the y-axis are the result of the basement lights being on. The abnormally large gaps in the data are periods when the Arduino was powered off because I was still tweaking and developing it. Finally, the short humps that occur everyday are the result of natural light coming through one of the basement windows. By zooming in on one of them, we can see even more detail: The intensity of natural light in my basement.
The first thing we notice is that the levels rise from zero to about 65 before falling and levelling out at close to 35 for two hours. This is followed by a another small increase before it ultimately decreases down to a value of ~10 where it levels out. That middle valley where the light levels are equal to 35 is due to the shadow cast on the basement window by our neighbour’s house to the south of us. The levelling out of the light intensity at 10 after all the daylight has disappeared is because a light out in the hallway is usually on in the evening. It is eventually turned off for the night, causing the light levels to drop to zero where they will usually remain until the next morning. I must admit, I’m impressed that the cheap $1.00 photoresistor is capable of capturing this level of detail, and that these trends are so easily interpreted from the graphs.

Participated in the
Sensors Contest


