

Introduction: Sending Data From Arduino to Excel (and Plotting It)


I've searched extensively for a way that I could plot my Arduino sensor reading in real time. Not only plot, but also display and store the data for further experimentation and corrections.
The simplest solution I’ve found was to use excel, but with a twist.
A PROGRAM THAT DOESN'T REQUIRE EXCEL TO PLOT DATA CAN BE FOUND HERE
https://www.instructables.com/id/Plot-Live-Arduino-Data-and-Save-It-to-Excel/
Also if you find this instructable interesting, perhaps you'll like another one I've made (about displaying live Arduino sensor readings on a Nokia 5110 LCD):
Step 1: What You'll Need
For this you will need:
-Windows (tested on xp)
-Arduino IDE
-Microsoft office (tested on 2010)
-PLX-DAQ (expansion for excel)
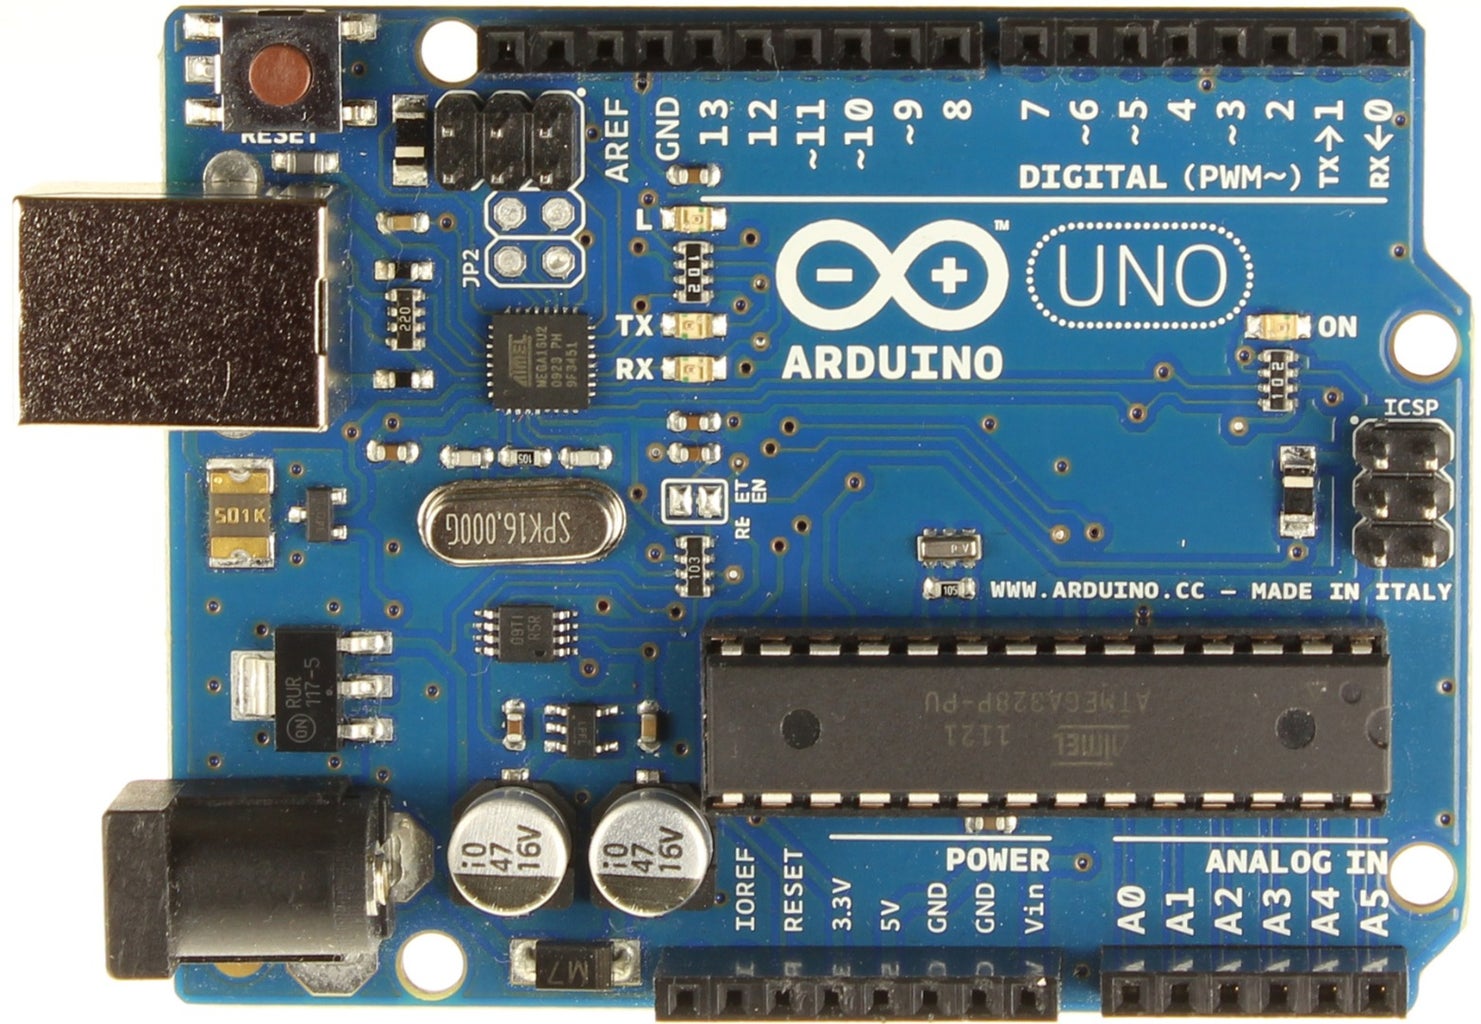
-Arduino (tested on UNO, but any board should work)
I am assuming that you’ve already got an Arduino, Windows, Arduino IDE and Excel. Here’s the link to download PLX-DAQ:
https://www.parallax.com/downloads/plx-daq
You only need to download and install it, it should work fine. After installation, it will automatically create a folder named PLX-DAQ on your Desktop in which you will find a shortcut named PLX-DAQ Spreadsheet.
When you want to use your Arduino to send data to excel, just open up the shortcut.
Step 2: Arduino Part

Now that we’ve got all that downloaded and installed, let’s start with the Arduino part.
Here’s a basic template I created that will display the time in column A and your sensor measurements in column B.
Of course, this is just a basic template, which is pretty straight forward and you can tweak it to suit your needs.
I’ve added explanations in the Arduino code so you (and I, after not working with it for a while) know which part of the code does what.
Here’s the sketch:
//always starts in line 0 and writes the thing written next to LABEL
void setup() {
Serial.begin(9600); // the bigger number the better
Serial.println("CLEARDATA"); //clears up any data left from previous projects
Serial.println("LABEL,Acolumn,Bcolumn,..."); //always write LABEL, so excel knows the next things will be the names of the columns (instead of Acolumn you could write Time for instance)
Serial.println("RESETTIMER"); //resets timer to 0
}
void loop() {
Serial.print("DATA,TIME,TIMER,"); //writes the time in the first column A and the time since the measurements started in column B
Serial.print(Adata);
Serial.print(Bdata);
Serial.println(...); //be sure to add println to the last command so it knows to go into the next row on the second run
delay(100); //add a delay
}
Obviously if you upload this code, it won’t work on it’s own!
You need to add a formula for Adata, Bdata and … . This template is just for reference so you know how to use the program. Just add Serial.read() function, name it Adata, Bdata and … and it should work.
Step 3: Sending the Data to Excel


Of course PLX-DAQ has more functions, which you can explore on your own by reading the instructions in the rar folder that you downloaded.
If you want excel to graph your data but can’t be bothered to read the instructions, here’s a short version of what you can do:
-use the (modified) code from my instructable
-connect your Arduino as you normally would
-DO NOT OPEN THE SERIAL MONITOR in Arduino IDE, it will not work with excel if you do
-open the shortcut to your PLX-DAQ Spreadsheet
-excel will say “This application is about to initialize ActiveX…”, just click OK
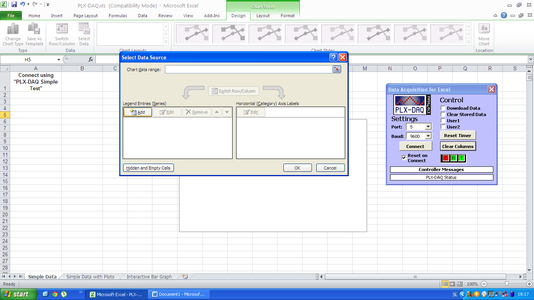
-a new window named Data Acquisition for Excel will appear
-select the usb port your Arduino is connected to (if it doesn’t work at first, go through the list of ports)
-where it says Baud, just select the number you put in your code at Serial.begin(), in my case that would be 9600
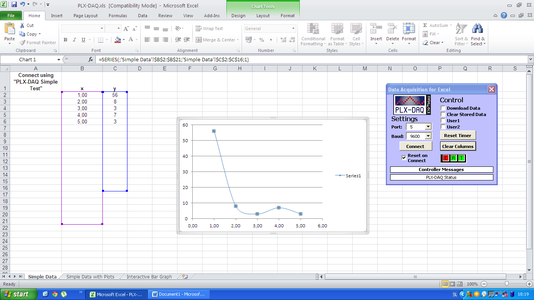
-create an empty graph
-select which columns of data you want on the graph for the x and y axis (the way to do this is a little different depending on your version of excel, but it’s not too hard to figure out)
-click collect data on PLX-DAX and it should start collecting the data
-excel will plot the information as it gets sent from the Arduino to excel in real time
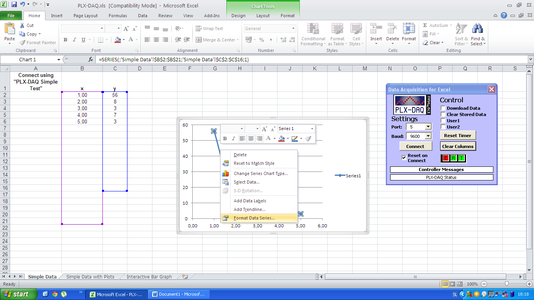
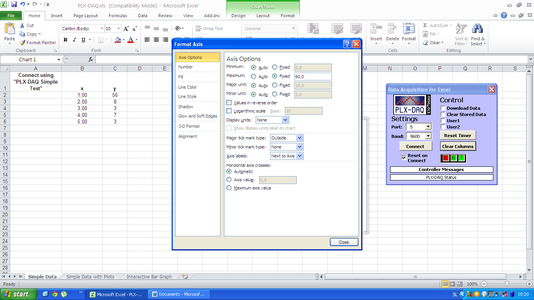
Depending on how precise you want your graph to be, you can change the characteristics of the graph. You can closely examine a section of the graph by shutting down data collecting, right click on the x or y axis and set it to a smaller frame. (normally it’s set to automatic)
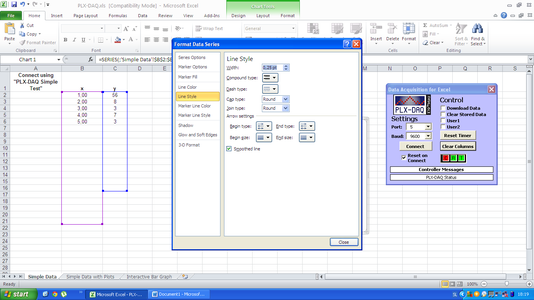
You can also right click on the curve that connects the points on your chart and select the color and thickness of the curve.
That’s it for the basics. I hope I’ve helped a few of you out by writing this. I know it took me quite some time to find this and to get it working.
P.S.
If you liked this instructable, perhaps you'll like another one I've made: https://www.instructables.com/id/Arduinonokia-lcd-d...
If you enjoyed this Instructable, consider visiting my Fundrazr page here. And of course, share.


