Introduction: Dekoboko: Road Quality Measuring With Bicycles

Attaching vibration sensors to a bike frame to log the quality of the road (bumps, holes, cobblestone) and uploading the data to the web for visualization and graphing.
Find smoother rides through the city, pick the offroad trails to match your skill, and help cities notice which roads need repair!
+++ UPDATE +++
We are competing for The Hackaday Prize 2015! Click here to view the project and give your support! Thanks!
DEKOBOKO THP 2015
Hackaday has also published an article on our project!
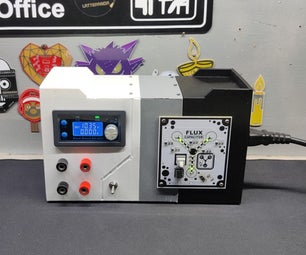
Step 1: Hook Up the Components

The Dekoboko hardware consists of an Intel Edison board using multiple modules from the Grove collection.
Attach the Grove Base Shield to your Edison board. The modules needed are:
- An accelerometer to measure the vibrations coming from the ground, through the wheels, onto the bicycle frame. Attach it to one of the I2C headers.
- A LED bar to get instant feedback on the road quality as you ride.
- A RPM sensor and/or a GPS sensor. To visualize the data, the bike gathers information about the distance traveled. The simpler case is a RPM sensor tracking the turning of the wheels to log the measured road quality. By using a GPS sensor, you can even overlay your information on a map; useful for route planning as well!
Step 2: Go for a Ride

When the system starts, it will automatically record the vibrations as you ride. By combining it with the location data from the RPM and/or GPS sensors, it creates a detailed map of bumps, holes, cobblestone paths and other road features. It is all stored in the internal memory, as you usually don't have WiFi connectivity while on the go.
Step 3: Upload Your Data

Once you get home, push the Upload button to transfer the gathered information to the Cloud. The server will accept the file with the quality of the road (smooth, bumpy, holes, ...) and add it to the database. The included timestamps help you reconstruct when you took which ride.
Step 4: Visualize and Share!

You can now get different visualizations of your data!
The quality of the road can be graphed over the traveled distance (to detect problematic road segments) or over time (good to measure your own performance, especially when off-roading). With GPS enabled, you are able to see the route, with different colors representing differences in sufrace quality. This will help you choose the smoothest path next time you ride. For off-road and downhill tracks, the vibration is often indicative of the skill level required for a certain segment. By sharing and viewing other people's trails, you can find the best one for you and your bike!
Happy biking!