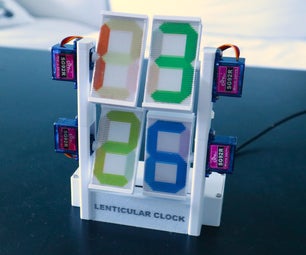
Introduction: Eyeballing Your Eyeball's Prescription: a BME60B Project

By: Hannah Silos, Sang Hee Kim, Thomas Vazquez, Patrick Viste
Magnification is one of the key features present for reading glasses, which are classified by their prescription of diopters. According to Michigan Technology University, a diopter is a focal length of the lens, usually measured in mm, in the unit of meters (Michigan Technology University). Because reading glasses have convex lenses, the focal length would be positive, causing the diopters to be positive as well (HyperPhysics). The focal length increases as the distance between the object gets further away from the actual lens, and this leads the diopters to decrease since they are inversely proportional. Therefore, having reading glasses with additional diopters would help the lens to zoom in the view so that it may seem like the focal length is less by increasing the value of the diopters.
The code presented will be used to predict the diopter of a lens with an unknown prescription. Two inputs are used to calculate the prescription: a photograph of the controlled background without using any lenses, and another photograph of the same background but through the lens of choice. The program will measure the distortion between these two photographs. From there, we will be able to estimate the lens' diopter and produce a result for the user to view.
For this Instructable, you will need:
- A black-and-white checkerboard pattern printed on an 11x8.5 in sheet of paper
- A camera with the ability to lock its focus
- A tripod, or something similar to secure the camera
- Various prescriptions of reading glasses
- MATLAB
Step 1: Take Photos


In order to calculate the magnification of a lens, you need to be able to compare it to the actual size of the object. For this project, we will be comparing a magnified image to a control image.
Thus, the first step is to take two photos of the same image — the first through just the camera, and the second through the lens of the reading glasses you want to test.
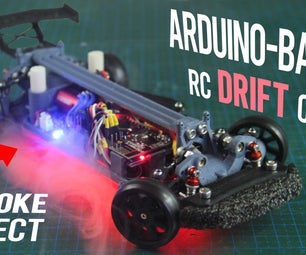
You will be taking a picture of a 8.5x11in black and white checkerboard with a 1in grid. Set up your camera 11in away from the checkerboard. Before taking the photos, lock the focus on the checkerboard.
Take a photo of the checkerboard without the reading glasses. Then, without moving anything, place the reading glasses in front of the camera and take the second photo.
Make sure that the position of your camera does not move in between shots. The only thing that should change between the two photos is the presence of the glasses lens in front of the camera.
When you’re done with the photos, upload them to your computer.
Step 2: Load the Images Into MATLAB

Open a new script.
First, specify the directory where the photos are stored. Then, use the dir function to extract .jpg images (or whatever file type your image is).
- Dir = 'C:\Users\kuras\Desktop\classes\SQ2\BME60b\Sandbox\testphotos'; GetDir = dir('*.jpg');
For our project, we wanted to prompt the user of the program for which files they wanted to compare. The first section asks the user to specify the control image, and the second asks the user to specify the test image.
- %Ask user which file is the control image.
- Control = input('# of control image.\n');
- ControlFile = [GetDir(Control).name]
- %Ask user which file is the image they want to analyze.
- ChooseFile = input('\n# of image you want to analyze.\n');
- PrescripFile = [GetDir(ChooseFile).name];
Step 3: Image Analysis


A colored image in MATLAB is of size MxNx3, whereas a grayscale image is MxN. This means that it’s faster to enhance/edit a grayscale image because there is less data to keep track of.
Use rgb2gray to convert the image to grayscale. (The imrotate function was used because our photos came in horizontal — this line of code may or may not be necessary in your version.)
- %convert to grayscale and rotate
- I = imread(ControlFile);
- I = rgb2gray(I);
- I = imrotate(I, 90);
Next, display the image. The subplot function is used so that the test image will be able to be next to the control in later steps.
- %display
- figure(1);
- subplot(1,2,1)
- imshow(I);
- title(ControlFile);
Use imcrop to prompt the user to crop the checkerboard out of the full image. The following code also shows a message box to provide instructions to the user.
- %crop out checkerboard for analysis
- waitfor(msgbox({'Use the cross hairs to crop out checkerboard.', 'Then double click area of interest.'}));
- I_crop = imcrop(I);
Use imbinarize to binarize the image.
- I_binary = imbinarize(I_crop);
Step 4: Calculate the Width of the White Squares on the Checkerboard.


Next, prompt the user to draw a line across the image using imline. This line should run horizontally across the checkerboard. It should start and end on a black square (it doesn’t matter where)— this is because we will be measuring the width of the white squares, not the black ones.
- %draw line
- figure(1)
- subplot(1,2,1)
- imshow(I_binary);
- waitfor(msgbox({'Click and drag to draw line spanning 9 boxes, from a black space to a black space.','Double click to confirm.'}));
- line = imline;
- position = wait(line);
- endpoints = line.getPosition;
Extract the X and Y coodinates for the endpoints of the drawn line.
- X = endpoints(:,1)
- Y = endpoints(:,2);
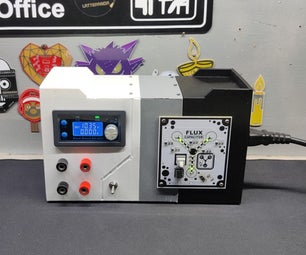
Use improfile to produce a graph based on the intensities found along the drawn line. This should resemble a square wave ranging from 0 (black) to 1 (white). Calculate the peaks and their locations as well.
- figure(2)
- subplot(1,2,1)
- title('Image intensity across the improfile line (Control)')
- improfile(I_binary, X, Y); grid on;
- [~, ~, c1, ~, ~] = improfile(I_binary, X, Y);
- [peaks, loc] = findpeaks(c1(:,:,1));
- hold on
- plot(loc, peaks, 'ro');
- hold off
Find the length of each plateau on the improfile graph using a for loop. Run the for loop for the same amount of peaks there are in the improfile graph. To calculate the length of each plateau, use the ‘find’ function to find all the locations where there is a ‘1’ instead of a ‘0’ intensity value. Then, calculate the length of that array to get the total length of the plateau, which should equal the width of a white square in pixels.
ControlPlateauList = zeros(1, length(loc));
for i = 1:length(loc)
if i == length(loc)
plateau = find(c1(loc(i):end,:,1));
else
plateau = find(c1(loc(i):loc(i+1)-1,:,1));
end
ControlPlateauList(i) = length(plateau);
end
Step 5: Repeat Steps 3 and 4 for the Test Image

*Note: when drawing the improfile line on the test image, make sure to draw it across the squares that correspond to the line you drew on the control image.
Step 6: Calculate the Magnification of the Lens.

The magnified measurements are calculated by dividing the mean of the length of the plateau, which was calculated in step 5, by the mean of the length of the control plateau, which was calculated in step 4. This is calculated to be 1.0884.
- magnification = mean(plateauList)/mean(ControlPlateauList);
Step 7: Finding R-squared and the User's Prescription Via Interpolation

Using the code:
- md1 = fitlm(GivenPrescription, MagArray);
- Rsquared = md1.Rsquared.Ordinary;
We can find the R-squared value of the graph GivenPresciption (our lenses given values) vs. MagArray (an array of the the magnification measurements ratios we calculated earlier). By having a high enough R-squared value, it can be inferred that there is a strong enough correlation to justify the use of this method. For this particular case, the R-squared value was 0.9912, which suggests a strong correlation and therefore are justified in using this method in analysis.
Using the function :
- Prescription = interp1(MagArray, GivenPrescription, magnification, 'linear');
We can interpolate the corresponding prescription value (on the x-axis) of our magnification ratio (a value on the y-axis) and find what the user’s prescription is.
Interpolating data is important for this method to work as it allows us to make assumptions about information we do not have, based on the information we do have. While a line of best fit would technically be a stronger candidate for the this assumption, creating boundaries to reduce the number of outputs serve the same effect as prescription glasses come in incremental uniform values anyways. This is explained in later steps.
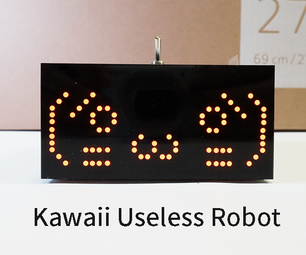
Step 8: Showing the User's Prescription on a Graph

Using the following code:
- figure;
- plot(GivenPrescription, MagArray, '-g')
- hold on
- plot(Prescription, magnification, 'bp')
- hold off
- grid
- legend('Data', 'Interpolated Points', 'Location', 'NW')
We can plot a graph that shows the Magnification Ratios versus the Given Prescription with a green line and the found data of our calculated magnification versus our interpolated prescription with a blue star. Then the legend labels the title, x-axis, and y-axis and places the legend in the top left corner.
Step 9: Narrow Down Your Prescription.

The following code is used to produce the rounding for the prescription:
- if Prescription <= 1.125
- CalculatedPrescription = '1.0';
- elseif Prescription <= 1.375
- CalculatedPrescription = '1.25';
- elseif Prescription <= 1.625
- CalculatedPrescription = '1.5';
- elseif Prescription <= 1.875
- CalculatedPrescription = '1.75';
- elseif Prescription <= 2.25
- CalculatedPrescription = '2.0';
- elseif Prescription <= 2.625
- CalculatedPrescription = '2.5';
- elseif Prescription <= 3
- CalculatedPrescription = '2.75';
- elseif Prescription <= 3.375
- CalculatedPrescription = '3.25';
- else
- CalculatedPrescription = 'unknown';
- end
The prescription found through interpolation does not necessarily reflect the actual prescription -- this is because there will always be slight variations in analyzing the photo due to human error. Thus, we need this step to classify the actual prescription.
The prescriptions that are given usually start from 1.0 diopters and increase by .25 in their prescriptions, so after calculating the prescription we want to determine the prescription that best suits what the user might need. After calculating prescription, we run it through the given If statements to check its value and determine which prescription is necessary. Anything less than or equal to 1.125, then the prescription is 1.0. Anything less than or equal to 1.375, the prescription is 1.25. Anything less than or equal to 1.625, the prescription is 1.5. Anything less than or equal to 1.845, the prescription is 1.75. And so on.
We have the values increasing since we are checking if the values are less than. If we did the values decreasing then the first if statement would read the first if statement all the time. If prescription is the smallest, we want it to recognize it as the smallest right away, so thats why the smallest value is what we started with. Anything higher than the highest value means that the prescription is not in range with our data, so it will give the “Unknown” string reading.