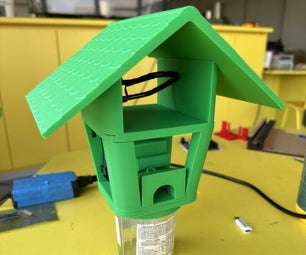
Introduction: Library Noise Detector With Humidity and Temperature Sensor
This is a temperature/humidity/noise detector to be used in any room, in this case a library. This device continuously takes the input devices and logs the data into the dashboard with a buffer of 1 hour and access every data intake online through phpMyAdmin. This device can take incoming Tweet events to do various jobs through outputting current readings to Twitter or mail. You can also access these functions through the dashboard.
Step 1: Parts:
Arduino Side
Arduino Mega or Uno
Arduino Ethernet Shield or Wifi Shield
Electret Microphone Amplifier - Adjustable Gain
Addressable LED Lights - (I used the NeoPixel Stick)
Raspberry pi Side
Raspberry pi 3
dht22 - temperature and humidity sensor
Step 2: Wiring
Arduino Wiring
Connecting Electret Microphone Amplifier:
1.Connect GND to Ground
2. Connect OUT to Analog 0
3. Connect VCC to 3.3V
Connecting NeoPixel Stick:
1. Connect GND to Ground
2. Connect DIN to pin 6
3. Connect VDC to 5V
Raspberry Wiring
Connecting DHT22:
1. Connect pin 1 to 3.3V
2. Connect pin 2 to GPIO4
3. Connect pin 4 to Ground
Step 3: Libraries/Nodes That Will Be Used
Arduino Libraries
Adafruit NeoPixel by Adafruit
PubSubClient by Nick O'Leary
Ethernet by Various
Raspberry Pi
mySQL - access data from phpMyAdmin -
sqlite - momentary data acquisition
node-red-dashboard
node-red-contrib-dht-sensor
make sure to install rpi-gpio - https://www.npmjs.com/package/rpi-gpio
Step 4: Arduino Code
This arduino code has been taken from - http://textuploader.com/5bf3a
and mixed with the Examples - Ethernet - Webserver example.
Here's the code: http://textuploader.com/drc3e
This will take the microphone input and translate it into a manageable sound level output. The NeoPixel stick will then turn on with the corresponding sound level.
Reference video: https://www.youtube.com/watch?v=pQwgZwrXfhc
NOTE*
The PubSubClient library is not in use. This library is used to connect the Arduino input signals to the Raspberry through mqtt. However, I could not get it to work, therefore, I omitted this function.
Instead of using an ethernet shield to transfer data, you can use Firmata to get the analog input from the Arduino on the Raspberry. However, you would have to transfer the Microphone input to a Function node in Node-Red which uses Java language.
Step 5: Raspberry Pi Node-Red
Volume Meter
This Volume Meter in the dashboard is a continuation of the data transfer from Arduino to Raspberry. Since, I couldn't get the mqtt working I just decided to use an inject node and random node to simulate the effect.
The Check Level - function node is used as a bus terminal to connect various function nodes that checks the level input. Based on the level input they will either turn on the different gauges in the dashboard.
These gauges nodes can be replaced by the template dashboard node to create more appealing dashboard
Step 6:
Mail/TweeterUpdates
Twitter to Mail Event and Twitter Input are the same, the only difference is where the data is being sent to.
For the input, the user can select where the information will be sent using the dashboard. The user can also Tweet out a message with a topic corresponding to the Twitter node search topic such as @raspieventmail @raspievent. When the Twitter input node detects these topics, it will send a signal to the Temp/Humd Sensor node. This node will take measurements and pass it into the Sensor Data function node. In this function, it will separate the incoming payload into a formatted node which will be sent to either gmail or Twitter.
Step 7: Dashboard
Dashboard Readings
An inject is used to repeated trigger the Temp/Sensor every 10 seconds. The reading from sensor is pushed to the gauge and graph dashboard nodes for the temperature. The reading from the sensor is also pushed to the Humidity function node that breaks down the message and outputs the humidity readings. This humidity reading is also pushed into the gauge and graph dashboard nodes (same as before).
This node block is used to monitor the temperature and humidity of the given room. The graphs have been edited to only display information from the past hour.
phpSQL Data Out
The readings from Temp/Humb is then parsed by the INSERT Statement function node. This separates the information into Temperature and Humidity readings. This ensures that the table created in the phpMyAdmin server on the Raspberry Pi can receive the information. phpMyAdmin will store all the data it has received.
SQLite Data Out
First, we need to create a database table. This database will only store information from the moment it gets information and cannot be retrieved when the Raspberry Pi is shut-off, hence we use phpMyAdmin.
CREATE Database Table - inject node
This will inject the SensorData - sqlite node with a Topic of:
CREATE TABLE SensorDataSQL( TIMESTAMP INT PRIMARY KEY NOT NULL, Temperature INT NOT NULL, Humidity INT NOT NULL)
creating a table in which information will be stored.
*Make sure to tick-off the Inject once at start? to automatically create the table at startup
DELETE old Data(1hours+) - inject node
This node will automatically delete information that are 1+ hours old. This inject node will contain the Topic:
DELETE FROM SensorDataSQL WHERE TIMESTAMP <= strftime('%s','now', '-1 hours')*1000
VIEW records - inject node
This node will be triggered manually to view the data through the debug node. Topic:
SELECT * FROM SensorDataSQL ORDER BY TIMESTAMP DESC LIMIT 100;
Now that you have created the table. We would need to get the information from the Temp/Humd Sensor and change it in a way that it can be stored into the sqlite node. This is where the Insert - function node comes in place.
SQLite Dashboard
This node block will allow the user to view the database through the dashboard.
VIEW Records - inject node
This node will repeatedly send VIEW signal to the SensorData - sqlite node to output the information into the Database - template node. This inject node needs a Topic of:
SELECT * FROM SensorDataSQL ORDER BY TIMESTAMP DESC LIMIT 100;
Database - template node
This node will take the information from the SensorData and outputs it into the dashboard in a dynamic user interface
*For more information on this please refer to: http://developers.sensetecnic.com/article/using-sq...
SQLite Database to Mail
This node block takes input from Twitter with the topic of @gbmaildatabase or through the Mail Database - button node on the dashboard. This will send the stored data (1hr worth of data) from the sqlite and mail to the specified mail.
Step 8: Build a Case
Wire it up and build a case.


