Introduction: Local Weather Station

As I was looking for a great project to make for my first year schoolproject I had many idea's of what to make but none of them I found challenging.
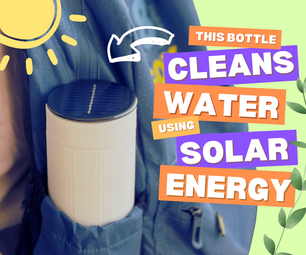
Later on I tought of making a Weather Station that had something special to it. I wanted to be able to store all my data and later use this for statistics. This project would be specially made for persons who have an interest for meteorology and want an at home created weather station that doesn't cost as much as the ones available on the market. The project is also made to maintain the ability to add or remove sensors at any time.
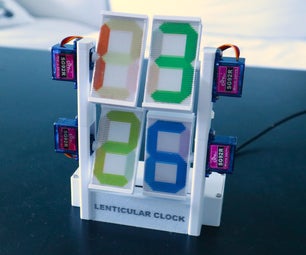
I was really happy when I saw my end result which turned out better than expected.
It is made of a Raspberry Pi 4 running linux.
- Apache Website (html css js)
- Eventlet (backend server website)
- MariaDB (database server)
Supplies
- Raspberry Pi 4:
- sd-card (min 16gb)
- Sensors:
- QS-FS wind speed sensor https://www.adafruit.com/product/1733
- Wind Sensor Garden Signal Output Aluminum Alloy Wind Direction Sensor Wind Vane Speed Measuring Instrument https://www.banggood.com/Wind-Sensor-Garden-Signal-Output-Aluminum-Alloy-Wind-Direction-Sensor-Wind-Vane-Speed-Measuring-Instrument-p-1624988.html?rmmds=myorder&cur_warehouse=CN
- DHT22 (humidity) https://www.bitsandparts.nl/Temperatuur-sensors-and-Thermokoppels/Temperatuursensor-en-luchtvochtigheidssensor-DHT22/p109717
- BMP280 (air pressure) https://www.bitsandparts.nl/Temperatuur-sensors-and-Thermokoppels/Barometrische-druksensor-hoogtemeter-temperatuursensor-I2C-SPI-BMP280/p124314
- DS18B20 (temperature) https://www.bitsandparts.nl/Temperatuur-sensors-and-Thermokoppels/Temperatuursensor-1-Wire-Dallas-DS18B20/p109705
- Power Supply's
- 5v power supply (RPi)
- 9v power supply (on an external breadboard power supply)
- Breadboard (x2)
- T-cobbler plus for RPi 4
- jumper wires
- IC's
- MCP3008
- PCF8574AN
- LCD Display 16x2
- LED (red
- Casing (optinal)
- wine crates
- wooden pole (2m)
- wooden plank (1m)
Step 1: Getting Things Ready
It is always of big importance to get all the items you need before you start working on a step. This will save you a lot of time while working trough it.
So first,
What do you need:
- Raspberry Pi 4:
- sd-card (min 16gb)
- Sensors:
- QS-FS wind speed sensor
- Wind Sensor Garden Signal Output Aluminum Alloy Wind Direction Sensor Wind Vane Speed Measuring Instrument
- DHT22 (humidity)
- BMP280 (air pressure)
- DS18B20 (temperature)
- Power Supply's
- 5v power supply (RPi)
- 9v power supply (on an external breadboard power supply)
- Breadboard (x2)
- T-cobbler plus for RPi 4
- jumper wires
- IC's
- MCP3008
- PCF8574AN
- LCD Display 16x2
- LED (red)
- Casing (optinal)
- wine crateswooden
- wooden plank (1m)
- pole (2m)
You can find all links where I bought these in the supplies section under the intro.
Step 2: Setting Up the RPi

For our project we need a RPi with the given software installed.
- Apache Website (html css js)
- Flask Socket-IO (backend server website)
- MariaDB (database server)
Before installing it is always handy to make sure you have the latest software installed on you RPi. To do this just execute the following command:
sudo apt update
Apache:
First lets talk about Apache. Apache is a webserver which is used all over the world. It runs your website flawlessly. The only thing you need to do is install it and put your website in the right folder and there it is.
sudo apt install apache2 -y
That's it!
To make sure everything is installed correctly surf to your raspberry pi Ip-address in your browser and see if you get the default website. If you have any problems regarding this step you can check the RPi website here.
Eventlet:
Now let's install Eventlet. It will run our backend server and will make the connection from our sensors to our website. For that we need a couple of packages.
pip3 install flask-socketio
pip3 install eventlet
pip3 install gevent
Mariadb:
Mariadb is a MySQL based database which makes relational databases. It is often used on the RPi and therefore there is a lot of help you can find on the internet. For more info you can go to this link.
apt install mariadb-server
Step 3: Connecting Sensors and Adding Code


To connect the sensors to our RPi we can use a T-Cobbler plus. This is a handy little tool which makes it possible to use all your pins on your RPi on a breadboard.
In my project I have 5 sensors:
- QS-FS wind speed sensor
- Wind Sensor Garden Signal Output Aluminum Alloy Wind Direction Sensor Wind Vane Speed Measuring Instrument
- DHT22 (humidity)
- BMP280 (air pressure)
- DS18B20 (temperature)
Wind speed sensor:
First off all I started of with the wind speed sensor because I was mostly excited about this sensor. It is a sensor with an analog signal of 0-5v output and needs a voltage of minimum 7 volts to work. I choose for the 9 volts adapter to power it.
To read in this sensor I used an MCP3008 which is an IC to read in Analog signals. The IC can work on 3.3V or 5V but I choose 3.3V to make it compatible with the RPi. This meant that I needed to change the output voltage from 5V to 3.3V I did this by adding a voltage divider created by 2 resistors (2k and 1k ohm).
Wind Direction Sensor:
Wind direction is as important as the wind speed therefore I will connect this next.
This sensor has the same specification as the wind speed sensor. It will also work on 9V and has an output voltage of 5 volts. Also this sensor we will connect to the MCP3008 via a voltage divider.
DHT22 (humidity):
The DHT22 reads the humidity. It gives you a value in percentage and its value can be read by using the I2C protocol on the RPi. Therefore you must enable the I2C ports in the Raspi-config. More info here.
BMP280 (air pressure):
The BMP280 is used to read the air pressure. Its value gets read via the SPI bus on the RPi. This protocol also needs to be enabled in the Raspi-config. For my code I used the Adafruit library.
DS18B20 (temperature):
The last sensor measures the temperature. this sensor is from Dallas and if you've had a little experience with Dallas you should probably already know that they use the 1Wire-bus. Don't be surprised if I say that this protocol also needs to be enabled in the Raspi-config.
How I connected the sensors:
As pdf I uploaded an electrical and breadboard scheme to make it a little easier.
After being able to connect the sensors successfully and you added the code required to read all the sensors you can go ahead and go to the next step. If you like to leave a sensor behind or would like to add more you can do so.

Step 4: Designing a Web Ui


Now we connected the sensors we need a design for our website.
We want the website to create an easy look while displaying all the realtime-data of the sensors.
Also we want to be able to see the history of these measured values per time interval.
So First I started looking around on the web for some inspiration. Most of all where just wheater info sites without really the design I was looking for. Weather stations who were already on the market had most likely a display. And out of that display my inspiration came. Most displays have a design with a grid look. This gave me the idea to create the home page where all sensors would be displayed.
But, I also said that I wanted to make a page where you can see the history of each sensor its values.
Because of that reason I also made a 2nd page in my design containing this. On this page I could see some extra information about my sensor that wouldn't be shown on my front-page and off course the history part.
After a few hours I had my full design worked out!
The design was made using Adobe XD.
Step 5: Creating Database

To get a break from the designing part I started on my database.
This database would contain all sensors (5), all actuators (2) and the values that those sensors had.
The database is quite easy and has a few relations.
You can see the database model in the photo.
Step 6: Coding the Website: Frontend (html Css)
Back to the Website!
Now I have a design I can start coding it as html css to really use it.
On the home-page:
I started of by considering each sensor as an element on my website. So that I could later on let this part generate by my Javascript code.
I also inserted random JS-holder classes into the elements. These would make it possible to change the content of that element
This took me a lot of time because I am not that good in this particular language.
Having done the home-page it was time to start at the history page.
On the history-page:
This page was a bit easier to recreate. In this page there were also js-holders to get the info about the sensor in, a realtime value slot and to display the table with al the measured values.
To create a tab-option on my website to choose between Table or Chart I did have to add a bit of Javascript to make the elements not display or do display.
Now we have a stunning website but can't show anything on it? Let's fix that.
You can find my code on my github repository: https://github.com/JensdbHowest/Howest-Project1
Step 7: Coding the Website: Backend (eventlet) + Coding Frontend (javascript)
Backend:
While the backend server is already installed we still need to implement this in our project. First we need to add some imports to make everything work properly.
<div><div>from flask import Flask, request, jsonify<br></div><div>from flask_socketio import SocketIO</div><div>from flask_cors import CORS</div></div>
To make the server start up we need to add the following:
<div>socketio.run(app, debug=False, host='0.0.0.0')</div>
Now the server is online but it won't be able to speak with the frontend.
It does't recieve or return anything.
Let's change that.
To ask for all the sensors in the database wel will add a route:
<div><div>@app.route(endpoint + '/sensors', methods=['GET'])</div><div>def get_sensors():</div><div> if request.method == 'GET':</div><div> s = DataRepository.get_sensors()</div><div> return jsonify(sensors=s), 200</div></div>
This code uses a class called DataRepository and speaks to the database. Here it gives us back the sensors we asked for.
We also need a route to ask the info about 1 specific sensor and another one for the values of a given sensor.
These are all routes but to make the realtime data possible. We need to send every interval the data the sensors just read. To do this we use the Socket-IO connection. It is a connection established from the moment someone loads the website with JS and it keeps this connection open. This is a full-duplex connection which means it is a connection that works in both ways (send and recieve) at the same time. To use this we need to add the following code.
<div><div>@socketio.on('connect')</div><div>def initial_connection():</div><div> print('A new client connect')</div><div> socketio.send("U bent geconnecteerd")</div><div> # # Send to the client!</div></div>This peace of code gets run when a client connects.
To get any message from the frontend you can use this code.
<div><div>@socketio.on('message')</div><div>def message_recieved():</div><div> pass</div></div>You can also send messages. This gets done by the following.
<div>socketio.emit('Update_RTD', dict_results, broadcast=True)</div>The first given argument can be anything you want but will correspond to what you put in your JS and you can send objects with it as well. This is optional.
Javascript:
It is important to add a bit of JS to get the server connected with the backend server to be able to display the current data and get info from the database.
We will call the socketIO functions we made to receive and send data.
When we recieve data as a Json Object we will dismantle it to get the information we want and then put it in the JS-holders we put in our website.
You can find my code on my github repository: https://github.com/JensdbHowest/Howest-Project1
Step 8: Making a Casing


The casing took a lot of work and can be done by any way you want. This is how I did it.
I took some Wine Crates.
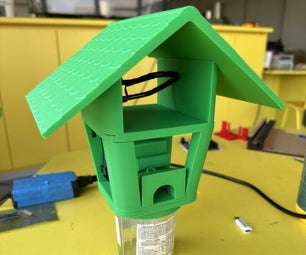
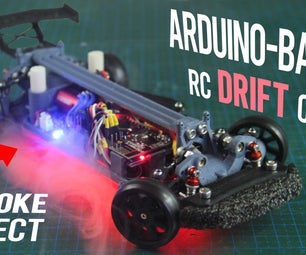
One of them I used as the box to contain my RPi and most of my sensors.
The wind speed sensor and wind direction sensor were of course not placed inside but on top of a crossbar placed on a pole. On this pole I hung that wine crate where I also made a door for.
You can see how I finished my project by looking at the photo's.
This is of course an example of how you can do it. You can do with it whatever you want.