Introduction: Plotting Shear Force and Bending Moment Diagram of a Beam in Your Browser Using Python


For those of us taking structural mechanics and strength of materials courses, we all know how difficult it can get when trying to verify our analysis results. This gets more complicated when doing beam analysis, as we are trying to get what our beam element's shear force and bending moment diagram will look like. In addition, when given a reinforced concrete design project, we also start by analyzing our beam elements, which transfer wall and slab load to columns and from column to foundation. This analysis and cross-checking are tedious and time-consuming when verifying our results by hand.
Hence, for those of us with an interest in developing finite element tools for structural analysis, this instructable is about how to create a simple beam model and plot its shear force and bending moment diagram using a python library called planeSections created by csbloom which is built upon openseesPy
PlaneSections is a lightweight finite element beam bending library built on OpenSeesPy. The aim of PlaneSections is to make beam analyses easier, which can be used to document structural calculations quickly. Being built on OpenSees, the structural results are reliable, and there is lots of room to create more complex models.
planeSection library has four core modules which are as follows:
- The Builder module is used to create the beam and beam elements. The beam class is the core class of the module, and the one the user interacts with the most.
- The Analysis module is used to analyze the beam using OpenSeesPy and document the results.
- The Diagram module is used to plot the beam model.
- The Postprocess module is used to plot the responses of the beam from the analysis, including force diagrams and deflections.
For an in-depth understanding and how to customize the existing planeSections library classes and methods, check the documenation.
And you can also check this kindle eBook for beginner friendly understanding of structural analysis using python
Supplies

Any simple pc that has google chrome installed.
This is the question we will work on:
Question: A Beam 25 m. long is supported at A and B and is loaded as shown above. Sketch the SF and BM diagrams.
Step 1: Installing the PlaneSections Library

#install the PlaneSections library using the python pip coommand in google colab

pip install planesections
Step 2: Creating Beam Model
# we are importing the planeSections library
import planesections as ps
#we are importing the plotBeamDiagram method for drawing our beam model
from planesections.core import plotBeamDiagram
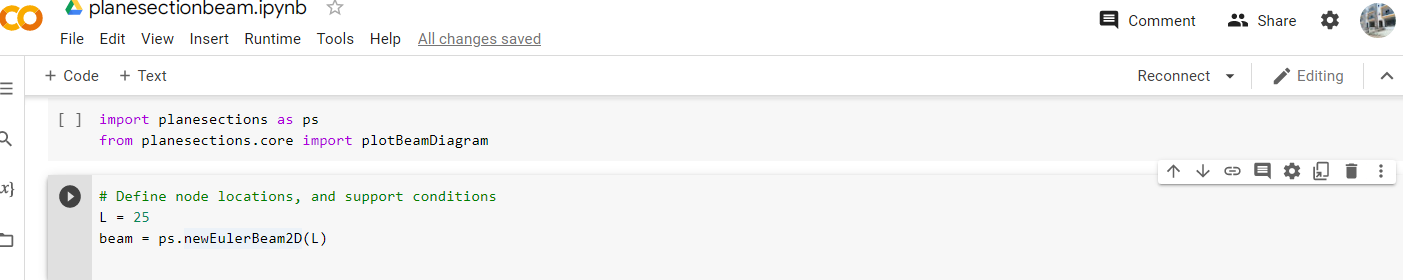
# Define node locations, and support conditions
L = 25 # beam length in meters
#lets instaniate or create a beam object using newEulerBeam2D function passing the length of the beam
# as an argument
beam = ps.newEulerBeam2D(L)
Step 3: Create Support Condions
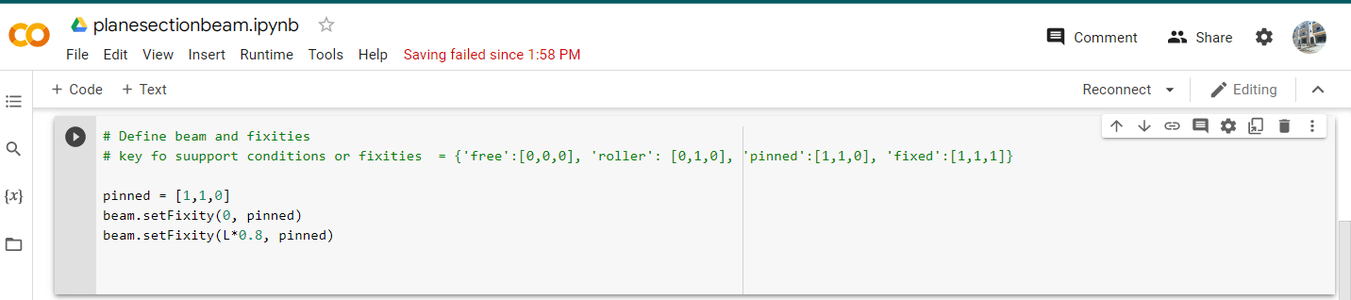
# Define beam with support conditions or fixities
# key for support condions or fixities  = {'free':[0,0,0], 'roller': [0,1,0], 'pinned':[1,1,0], 'fixed':[1,1,1]}


pinned = [1,1,0] # support condition

# we invoke the setFixity meethod and pass the position of our beam support as the first argument and the support    # type as the second argument
beam.setFixity(0, pinned)
beam.setFixity(L*0.8, pinned)
Step 4: Create Loadings on the Beam
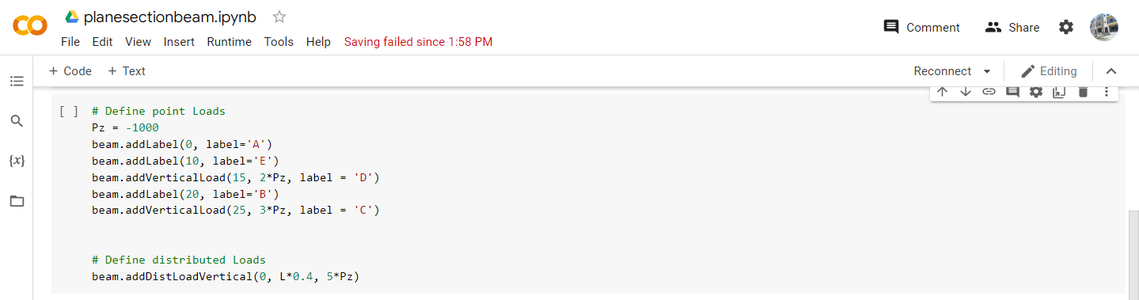
# Define point Loads and labels
Pz = -1000  # This represen 1kN in the downwad direction
# we use the addLabel method of the beam object and the first argument specify the distance from starting length of # our beam to place our label annd the label name as the second argumment
beam.addLabel(0, label='A')
beam.addLabel(10, label='E')
beam.addLabel(20, label='B')

# addVerticalload method define a point load where the fi9rst argumment is the positi0n of the load, the rgumnt is # the load magntude nd the third arguent i the label indicatting the load position on the beam
beam.addVerticalLoad(15, 2*Pz, label = 'D')

beam.addVerticalLoad(25, 3*Pz, label = 'C')

# Define distributed Loads
# the first argument is the point where the distributed load starts and the second argumment is where it stops and # the third argumennt is its magnitude

beam.addDistLoadVertical(0, L*0.4, 5*Pz)
Step 5: Visualizing the Created Beam

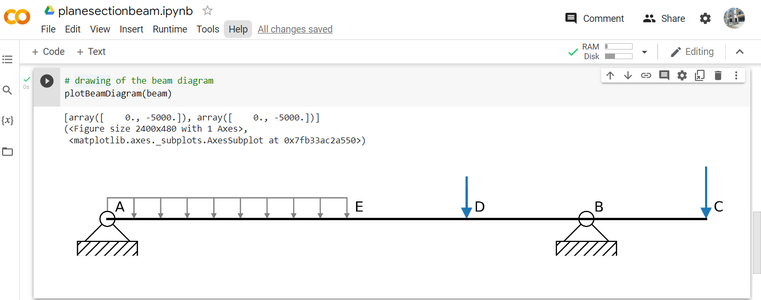
# drawing of the beam diagram using the plot plotBeamDiagram method and our beam object as an argument
plotBeamDiagram(beam)
Step 6: Shear and Bending Moment Diagram


# instantiate the analysis object
analysis = ps.OpenSeesAnalyzer2D(beam)
# Run the analysis
analysis.runAnalysis()


# Plot the ShearForce and Bending Moment Diagram
ps.plotShear2D(beam, scale = 0.0002, yunit = 'kN')
ps.plotMoment2D(beam, scale = 0.0002, yunit = 'kNm')
Step 7: Result and Conclusion

The picture above is the result from the textbook where I got the question from which is similar to my plot as shown in step 6.
you can run the code here
The planeSections and openseespy library are flexible for adding more functionalities. let's explore the power of numerical methods and create our own finite element software.