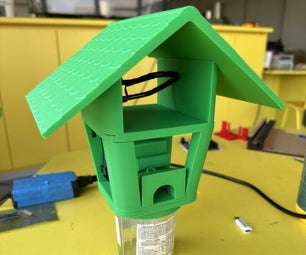
Introduction: Weather Station
Ever feel uncomfortable during small talk? Need cool things to talk (okay, brag) about? Well we have the thing for you! This tutorial will allow you to build and use your very own weather station. Now you can confidently fill any awkward silence with updates on the temperature, pressure, humidity, altitude and wind speed. Never again will you resort to the bland, "weather's been nice" once you complete this neat project.
Our weather station is fully equipped in a water resistant box with different sensors that record various natural measurements and save them all to the same SD card. An Arduino Uno is used to easily code the weather station so that it can work remotely. In addition, any number of sensors can be added or integrated into the system to give it an array of different functionalities. We decided to use various sensors from Adafruit: we used a DHT22 Temperature and Humidity sensor, a BMP280 barometric pressure and altitude sensor, and an anemometer wind speed sensor. We had to download several code libraries in addition to piecing together some different codes to get all of our sensors to run together and log data on the SD card. The links to the libraries are commented in our code.
Step 1: Gather Materials
- Arduino Uno
- Protoboard
- 9V Battery
- Adafruit Anemometer Wind Speed Sensor
- Waterproof Housing
- Adafruit BMP280 Barometric Pressure and Altitude Sensor
- Adafruit DHT22 Temperature and Humidity Sensor
- Adafruit Assembled Data Logging Shield
- Hot Glue
It is important at this step to just make sure that your Arduino is working and can be programmed from your computer. We also ended up soldering all of our components to a protoboard, but a breadboard can also be used to connect the sensor to the Arduino. Our protoboard made all of our connections permanent and made it easier to house the components without worrying about jostling them out of place.
Step 2: Add a Data Logger
This step is easy peasy. All you have to do to accomplish this step is snap the data logger in place. It fits right on top of the Arduino Uno.
Getting the data logger to actually log data requires some coding. The logger records the data to a SD card that fits into the shield and can be removed and plugged into a computer. One feature of the code that is helpful is the utilization of the time stamp. The time clock records the day, month and year in addition to the second, minute and hour (as long as it's hooked up to the battery). We had to set that time in the code when we started, but the data logger keeps the time as long as the battery on its board is connected. This means no resetting of the clock!
Step 3: Set Up the Temperature and Humidity Sensor
- Connect the first pin (red) on the sensor to the 5V pin on the Arduino
- Connect the second pin (blue) to a digital pin on the Arduino (we put ours in pin 6)
- Wire the fourth pin (green) to the ground of the Arduino
The sensor from Adafruit that we used only needs one digital pin on the Arduino to collect data. This sensor is a capacitive humidity sensor. What this means is that it measures the relative humidity with two metal electrodes separated by a porous dielectric material between them. As water enters the pores, the capacitance is altered. The temperature sensing portion of the sensor is a simple resistor: the resistance changes as the temperature changes (termed a thermistor). Although the change is non-linear, it can be translated into a temperature reading that is recorded by our data logger shield.
Step 4: Set Up the Pressure and Altitude Sensor
- The Vin pin (red) gets connected to the 5V pin on the Arduino
- The second pin isn't connected to anything
- The GND pin (black) is connected to the ground on the Arduino
- The SCK pin (yellow) runs to the SCL pin on the Arduino
- The fifth pin isn't connected
- The SDI pin (blue) is connected to the Arduino's SDA pin
- The seventh pin isn't connected and isn't pictured on the diagram
The Vin pin regulates the voltage to the sensor itself and takes it down from 5V input to 3V. The SCK pin, or the SPI Clock Pin, is an input pin to the sensor. The SDI pin is the serial data in pin and carries the information from the Arduino to the sensor. In the diagram of the Arduino and breadboard set-up, the pressure and altitude sensor pictured wasn't the exact model we used. There is one less pin, however, the way that it is wired is the exact same as the way that the actual sensor was wired. The way the pins are connected reflects the pins on the sensor, and should provide an adequate model for the set-up of the sensor.
Step 5: Set Up the Anemometer
- The red power line from the anemometer needs to be connected to the Vin pin on the Arduino
- The black ground line should be connected to the ground on the Arduino
- The blue wire (in our circuit) was connected to the A2 pin
One important thing to consider is that the anemometer requires 7-24V of power to run. The 5V pin on the Arduino just isn't going to cut it. So, a 9V battery must be plugged into the Arduino. This directly connects to the Vin pin and allows the anemometer to draw from a larger power source. The anemometer measures windspeed by creating an electrical current. The faster it spins, the more energy, and thus the more current, the anemometer sources. The Arduino is able to translate the electrical signal it receives to a wind speed. The program we coded also does the necessary conversion to get the wind speed into miles per hour.
Step 6: Check the Circuit and Run Some Tests
Pictured above is our completed circuit diagram. The temperature sensor is the white, four-pinned sensor in the middle of the board. The pressure sensor is represented by the red sensor on the right. Although it doesn't match the sensor we used exactly, the pins/connections will match up if you align them left to right (there is one more pin on the sensor we used than in the diagram). The anemometer's wires matched the colors we assigned them in the diagram. In addition, we added the 9V battery to the black battery port in the bottom left corner of the diagram on the Arduino.
To test the weather station, try breathing on the temperature and humidity sensor, spin the anemometer, and take data at the top and bottom of a tall building/hill to see if the temperature sensor, anemometer, and pressure/altitude sensor are collecting data. Try taking the SD card out and plugging in into a device to make sure the measurements were recorded properly. Hopefully everything is running smoothly. If not, double check all of your connections. As a back-up plan, try checking the code and seeing if any errors have been made.
Attachments
Step 7: House All the Components
Now's the time to make it look like a real weather station. We used an Outdoor Products waterproof box to house our circuit and most of the components. Our box already had a hole in the side with a penetrator and a rubber gasket. This allowed us to run the temperature sensor and the anemometer's wires outside of the box through a hole drilled in the penetrator and sealed with epoxy. To solve the issue of housing the pressure sensor inside the box, we drilled small holes in the very bottom of the box and put a riser on each corner of the bottom to keep it sitting above ground level.
To waterproof the wires connecting the anemometer and temperature sensor to the main circuit board, we used heat shrink tape to seal any connections. We ran the temperature sensor beneath the box and attached it (we just didn't want the tinted plastic to trap heat and give us false temperature readings).
This isn't the only housing option, but it's definitely one that'll get the job done for a fun project.
Step 8: Enjoy Your Personal Little Weather Station!
Now's the fun part! Take your weather station around with you, set it up outside your window, or do whatever else you'd like. Want to send it up in a weather balloon? Check out our next Instructable!


