Introduction: Arduino in the Classroom - a Simple Experiment in Measuring and Modeling Water Pollution


One thing I find exciting about the Arduino and other readily-available microcontrollers is the potential for use in the classroom. In this Instructable, I'll share a simple Arduino-based project that allows students (or anyone!) to study a toy-system that models the flow of pollution in a connected series of "lakes." This particular toy-model was inspired by the Great Lakes system in North America and the question "If water from a clean lake flows into a polluted lake and the mixture flows out, how long till the polluted lake is clean?"
My particular interest in designing this and related projects is in finding hands-on ways to teach kids the art of mathematical modeling. I try and design projects where the modeling requires learning a little science, the mathematics is accessible and interesting, and that are hands-on, allowing kids to gather real data, and play with the system and the mathematics together. In this Instructable, I'll focus on building the experimental system, but in the final step, will talk a bit about an approach to modeling your data mathematically.
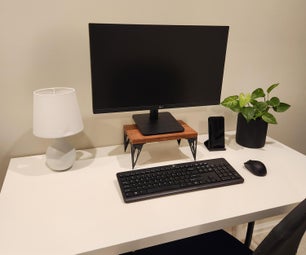
First, let's look at what we're trying to build. In the picture above, you can see the final system with all parts labeled. The basic idea is that we have three tanks, labeled Tank #1, Tank #2, and Tank #3. Both Tank #1 and Tank #2 hold aquarium pumps with the outflow from Tank #1 leading to Tank #2 and the outflow from Tank #2 leading to Tank #3. The idea is that Tank #1 will initially be filled with clear water, Tank #2 will be filled with "polluted" water, and Tank #3 will serve as an empty reservoir. When the pumps are turned on, clear water will flow from Tank #1 to the polluted tank, Tank #2, and the mixture will flow into the reservoir, Tank #3. Our goal is to understand how the amount of pollution changes in the initially polluted tank, Tank #2. That's where the Arduino comes in. We'll monitor "pollution" levels in Tank #2 by using a light source and a photocell arranged across the tank, and the Arduino to capture pollution readings as the system evolves. Let's get started!
Step 1: Parts List
You'll need the following parts for the "lake" part of the project:
- 2 X Small aquarium pump
- 3 X Clear plastic boxes (I purchased this set of 4, you really only need one clear container.)
- Power strip with on/off switch (allows you turn on both pumps at once.)
- Water
- Food coloring
For the data acquisition part of the project you'll need:
- Arduino (I used an Arduino Diecimila, but any Arduino should work.)
- 1 X Photocell
- 1 X 10k resistor
- Light source (I used this hanging LED flashlight, worked well.)
- Block of wood to mount photocell
- Jumper wires
- PLX-DAQ plug-in for Excel (This is a free Excel plug-in that captures data sent via serial from Arduino.)
Note that here we'll use Excel and PLX-DAQ to rapidly gather the data from the Arduino in a format that's then easy to plot. I've found this to be a very easy way to pull-off this part of the project and very accessible to students. But, there are lots of ways to use Arduino to log data and you should feel free to try other techniques.
Step 2: Setup Your Arduino and Photocell


In the diagram, you'll find the wiring scheme for the Arduino, resistor, and photocell. However, we'll want to be able to position the photocell right up against Tank #2 later, so we need to solder some long leads onto the photocell before wiring it to the Arduino. I soldered 10" long leads to the photocell and then made sure the legs were electrically isolated from one another with some heat-shrink tubing and electrical tape. You can see the final result in the picture above. Once you've wired-up your photocell similarly, double-check your complete Arduino wiring.
The sketch for your Arduino is quite simple:
//Photocell sketch for Arduino
//Set up to read photocell through A0 and pass data to Excel via PLX-DAQ
int photocellPin = 0;
int photocellReading;
void setup(void) {
Serial.begin(9600);
}
void loop(void) {
photocellReading = analogRead(photocellPin);
Serial.print("DATA,TIME,"); // send command to Excel
Serial.println(photocellReading); // the raw analog reading
delay(1000); //Delay one-second between readings
}
Once you've uploaded the sketch to Excel, open the PLX-DAQ spreadsheet. A box will pop-up called "Data Acquisition for Excel." Select your Arduino's port and set the baud rate to 9600. Then click "Connect." On the tab called "Simple Data" you should see two columns of data appear, one called "DATA," the other called "TIME." Every second, a new entry should appear. As you move your photocell in and out of the light, data points should vary.
Step 3: Setup and Prep Your "lakes"

Next, we want to setup our three tanks and our aquarium pumps. We're going to place our pumps in Tank #1 and Tank #2. Before you do this, check to see if your pump allows you to set a flow rate. Make sure you set the flow rate to be the same on both pumps. I used the lowest possible pump speed setting.
Place your pumps in Tank #1 and Tank #2 as shown and as in the picture showing the full setup, position the outflow from Tank #1 so that it feeds into Tank #2 and the outflow from Tank #2 so that it feeds into Tank #3. Now, fill Tank #1 and Tank #2 with equal amounts of water. Leave Tank #3 empty! This will be your overflow tank. Plug both pumps into the power strip, leaving the pumps off for now.
Step 4: Position Your Photocell for Data Collection
Now, we need to find some way to position the photocell flush against one side of Tank #2 and approximately in the middle of that side. As show in the picture, I used a piece of scrap wood. I drilled a hole in the wood large enough to fit the photocell into, snugly. Inserting the photocell into the wood, the the block could then be positioned flush against the side of Tank #2.
On the side opposite your photocell, position your light source such that, when on, the light will shine through Tank #2 and toward the photocell.
Step 5: Test and Pollute!
Now, with your Arduino setup and acquiring data, turn your light source on. With clear water in Tank #2 and the light source on, you should obtain a photocell reading of around 1000.
The next step is to "pollute" Tank #2. As our source of pollution, we'll use food coloring. Add a few drops of food coloring to Tank #2 and observe readings from your photocell. As you add food coloring, the photocell reading should decline. A mixture of red and green food coloring produces a satisfyingly polluted color to the water in Tank #2 and should reduce your reading from around 1000 down to about 800. Once you've achieved this, you're ready to run the experiment and see how the pollution flushes out of the system as we pump in clean water from Tank #1 and pump out the mixture into Tank #3.
Step 6: Start Flushing!
First making sure that your Arduino is acquiring data into your Excel spreadsheet, turn your pumps on. By eye you'll be able to see the color of the water in Tank #2 changing and your Arduino should be capturing this change second by second. Run your pumps till Tank #1 is nearly empty, and then turn them off.
Step 7: Examine and Analyze Your Data


What we've done in this project is setup a system where the amount of light passing through Tank #2 serves as a proxy for the amount of "pollution" (food coloring) in the tank. Our Arduino is capturing this proxy "pollution amount" as our system pumps. In the first figure in this section, we've plotted the raw photocell data from one run of this system. You can see how the photocell reading changes as red dye was added, green dye was added, and as the pumps were turned on and flushed the system. This is analogous to the Great Lakes and other water systems where one large polluted body of water is "flushed" by one or more clean bodies of water.
Note that the photocell readings are really opposite to pollution levels. That is, when the tank is fully polluted, the photocell reading is low and when the tank is un-polluted, the photocell reading is high. In the second figure we've transformed our data from light readings to "pollution" readings by subtracting off the clear-water photocell reading. In this case, 1000. So, the data in the second figure can be interpreted as pollution levels.
The mathematical modeling question here is - Can we build a mathematical model that would predict this curve? Now, recall, we set the speed of our pumps to be the same. This means that the volume of water in Tank #2 remains the same throughout our experiment. In turn, this means that we can build a simple mathematical model here by recognizing that the change in the amount of pollution in a little bit of time from now is equal to the amount of pollution we have now minus the amount of pollution that flows out in that little bit of time. Mathematically, you can express this as:
C(t+dt)V = C(t)V – C(t)Rdt
Here C(t) is the amount of pollution in the tank at time t, V is the volume of the tank, R is the flow rate, and dt is that "little bit of time" we mentioned above. Hopefully this is enough to get you started in thinking about how you might analyze your data and be able to predict the curve you measured. I hope you've enjoyed this Instructable. I look forward to finding other simple ways we might use the Arduino in the classroom!

Participated in the
First Time Authors Contest 2016

Participated in the
Arduino Contest 2016