

Introduction: Building a Copenhagen Interpreter


Disclaimer 1: The following represent preliminary results. I have yet to perform a proper statistical analysis. I myself am convinced that what I write here is purely speculative until I set up proper data collection and perform the requisite mathematics. Please refrain from telling anyone that anything presented here is "fact" until I can defend such a statement.
Disclaimer 2: This project is not safe for a wide variety of reasons. If you insist on attempting it, please observe adequate safety procedures. I am not qualified to recommend anything specific, so please perform extensive research. Your safety is your responsibility.
What I am describing here are my attempts to demonstrate the Copenhagen Interpretation of Quantum Mechanics. This does not prove other interpretations as incorrect, it only proves that the Copenhagen Interpretation is useful for explaining the behavior of this device. For lack of a better name, I name this device a "Copenhagen Interpreter". Rather ironically given it's name, if successful the device will produce nothing but provably inutterable nonsense.
The Copenhagen Interpretation was developed by Bohr and Heisenberg. Simply put (by wikipedia):
[It] rejects questions like "where was the particle before I measured its position" as meaningless. The measurement process randomly picks out exactly one of the many possibilities allowed for by the state's wave function.
What I will try and accomplish here is to build a "small" device that measures a system which may exist with some probability as a number of discrete states. Further, the state the system will exist in at time "N" cannot be predicted even given perfect perfect knowledge of the system, infinite computing power and infinite time. In other words, if the source can sustain maximum possible entropy, this device will be a nice demonstration of the Copenhagen Interpretation at work.
Being mortal, I don't have perfect knowledge of the system, infinite computing power or infinite time. What I do have is statistics, which is as close to any of these distasteful things as I care to get.
For fellow stats geeks, I'll be using P=0.01 throughout this experiment.
Step 1: Entropy Source
To begin we need a source of entropy. Not just any source... flipping coins, rolling dice, or observing the behavior of certain celebrities is not sufficiently random. Coin flips, dice rolls, and celebrity drug rehab are what we might call "large systems", which the Copenhagen Interpretation suggests are best described by classical physics.
The source of entropy for our purposes must be "small".
A source where quantum tunneling occurs seemed to me like a good place to start, as it only occurs on a small scale. As a consequence of the Heisenberg Uncertainty Principle, we cannot know for certain both where a particle is, and how fast it is moving (Note: this will be far from a complete treatment of the topic). As the measurement error decreases with respect to velocity, it increases with respect to position and vice versa. Therefore, if there exists a particle and a potential well, we cannot be certain the particle is within the well while being certain that it is traveling below the escape velocity for that well... it's all a matter of probability. (My reasoning may be incorrect here: please correct me if so)
Alpha decay is caused by quantum tunneling. If we have some macroscopic amount of an alpha-emitter, measuring alpha decay meets our criteria for a "small source", since it represents an individual atom decaying. Furthermore, knowledge about the particles within an atom useful in predicting alpha decay cannot be determined due to the nature of quantum tunneling vis. The Uncertainty Principle... So even given perfect knowledge of the system, and infinite time, you could never do better than pure chance when trying to determine the time of the next measured decay.
So, we will use a 0.9 microcurie sample of Americium-241. It's readily available, legal to own in my area, and not likely to kill me.
Step 2: Detector

The detector was a source of notable frustration. I didn't want to use a Geiger tube, as it would require high voltage equipment I don't have.
I had heard of solid-state detectors based upon the principle that a reverse biased photodiode can detect incident particles. I decided to try it out, expecting it to work at the very least with the few 60KeV gamma rays the source produces.
I was in for a surprise: I couldn't get anything to work. In theory, incident particles would strike the depletion layer of the semiconductor as increased by the reverse bias, transferring enough energy to the silicon lattice to knock some electrons out of the outermost electron shell and into a new shell (called the conduction band). The device would then allow a small current to pass through for a very short time. I managed to get a lot of nothing out of it, even after connecting the signal (or lack thereof) to a 3-stage MOSFET amplifier.
In frustration, I disconnected the power. It then condescended to produce a signal...
What I think I was observing is a variation on the photoelectric effect. All PIN photodiodes act as small solar panels when exposed to natural light. Natural light has very little energy per photon compared to our alpha particles... which in our case are around 5 MeV. I had by chance removed the glass window on the photodiode to ease particle capture, and the system was sealed against light... so it seems consistent. An identical photodiode without the source produced only a signal of 60Hz interference.
In the photodiode with the source attached, there was what appeared to be random variation in the 60Hz interference. Furthermore, I estimated the frequency of these variations to be 15,000-50,000 counts per minute, consistent with the strength of my source.
Finally, upon careful repeated observation, some of the voltage peaks on the counts were rarely roughly double in size... which is consistent with random data as opposed to nonrandom waveform.
I hesitate to make any decisive conclusions, but I may be detecting alpha particles basically using a glorified solar panel. As far as I know, this technique is undocumented. If it does represent a novel technique, I explicitly release this detection technique under the GPL.
The first photo is of a single "event" measured at 200 microseconds per centimeter. The second photo is on a much longer time scale... 1ms/cm if I remember right. There is unfortunately quite some noise, but you can still see there are some very stochastic deviations in the noise. One of the events is quite a bit bigger than the rest, and may indicate the coincidence of two events. It took some effort to find such a thing, as on longer timescales the events are hard to see. The giant spikes are artifacts of my aging but indispensable oscilloscope.
I should restate that these results are very preliminary. It remains that I run the experiment with better shielding to eliminate the noise. Then, I'll need to amplify the signal, automate data collection with a microcontroller... and finally test the probability of true randomness... or determine information density if you prefer such terms.
I have an idea or two about practical uses of this device if I can confirm this effect.
Step 3: Additional Info

Here's a small comic which demonstrates how the detector was originally supposed to work. I have no illusions of being good, or even acceptable, at drawing.
What actually happened was not a sudden change in the conductivity of the photodiode silicon lattice, but a short-lived buildup of charge as demonstrated by the oscilloscope photographs, akin to the photoelectric effect.
Reverse-bias is *supposed* to improve event capture by expanding the depletion layer, and cause the charge buildup to be shorter lived (but still visible), improving performance... but I could not conspire to get such a thing to work.
If the correct components find me, I will try to repeat this experiment with them in an attempt to cheaply increase sensor area, as well as render the experiment in its entirety more easily reproducible... the current photodiode is a Hamamatsu S1223-01. I have some left over from a failed experiment involving single-photon detection. A very nice product, however rather expensive for a hobbyist.
Step 4: New Developments


None of my projects is ever truly "completed". This section will describe new developments as they occur.
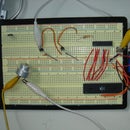
The only thing I have to report so far is that I borrowed a 1L steel paint can from my workplace (we give them away anyway), and used it as shielding from electromagnetic interference. I hardly had to do anything more than shove the detector/source inside, and use the can as the external oscilloscope ground.
The results were immediate and drastic. The 60Hz interference as well as the (mysterious) ~200Khz interference I always pick up are apparently completely eliminated by this trivial modification. There are nice voltage spikes visible, and look exactly as they should.
I find it difficult to believe that this is actually working, but it seems fortune has favored me today. My next step is to collect a lot of data and perform statistics which I will publish as a separate instructable. Finally, I'll get this working with components that are more easily obtainable.
Our first image here is the entropy source the modified photodiode at a "medium" sampling rate, encased in the new EMF shielding. The extremely rapid oscillations present in two parts are artifacts of my quirky oscilloscope. The voltage spikes followed by the apparent logarithmic decays are our quantum incidents.
Our second photo is similar, but at a higher sampling rate showing the individual incidents at a better resolution. There just happen to be 4 in a row in close proximity... this was not commonly observed, but made for a cute photo.
Our final photo is a pseudocontrol. It is an unmodified photodiode encased in the same shielding, with no entropy source. The scope settings were preserved as compared to the previous two photos. As you can see, there is a lot of nothing happening!
I say "pseudocontrol" since it is an unmodified photodiode. The modification consisted of removing the glass window protecting the semiconductor... and I do not immediately feel like either disassembling my working detector or getting covered in ground glass again carefully removing the window.
August 5th: I have ordered a USB oscilloscope with 60Mhz bandwidth... not only does this outclass my previous scope (which I will miss), it allows for automated data collection, stored as a txt file. I have a SAS UNIX license for academic use, statistical analysis will follow.
Sept. 11th: It seems that my new scope falls short in one area. While it has higher bandwidth and more features than I can shake a stick at, it does not seem to pick up weak signals (under 10mV) as well as my old scope. I will need to build a MOSFET amplifier before I'll be able to see anything interesting. Unfortunately, I've committed to several other projects which I must see through before I'll have time to work on this again.
November 25th: I picked up a new ancient scope with better sensitivity and 5Mhz bandwidth. I can once again observe the effect, and while I do not have a digital storage function on this scope, it should be sufficient to resume work on this project. On this scope, the logarithmic voltage decay curves caused by particle impact are more apparent, due to the higher bandwidth I assume (5Mhz instead of 2Mhz)... no more jagged lines!
Step 5: Things to Come...

November 28th (and some of the early hours of 29th): Based on the data from the 5Mhz scope using a new, larger Faraday cage, I designed an open-loop (130dB gain) differential amplifier circuit for use with the device. The whole thing has to run within the Faraday cage or noise will render the whole circuit inoperable. Everything worked on the first try (Which is quite abnormal), and now I can see voltage spikes for each particle impact. They are a sudden increase of 20mV over around 2 microseconds, followed by a perfect logarithmic decay over around one millisecond.
The results of this experiment, as well as the goal of all of this work will be published in a new instructable within the next few months.
For now, I leave you with the readout from a Hantek DSO-2150 USB 150 megasamples/sec scope, that has been amplified using a differential amplifier based on the OPA 2132... It shows the impact of 1 or 2 helium nuclei at ~5MeV, overlapping. Note how they produce peaks of the same amplitude, suggesting two particles of similar energy hitting the detector. It is also (remotely) possible that one particle had an elastic collision, and then hit another silicon atom in the detector a second time within 20 microseconds, or that there was some sort of secondary emission, but in this case we would expect it to be unlikely because the two peaks have similar amplitude.
The particle detector meets all design goals. It detects the incidence of alpha radiation with excellent resolution and low noise. The next phase of the project is data acquisition, statistics, and the construction and programming of a microcontroller that interprets this data in such a way that a computer can make use of it. This will be called the "Quantum Entropy Accumulator", since... well... it accumulates entropy from a quantum source. Forgive my lack of originality, I'm tired.


