Introduction: Urban Noise & Air Pollution Monitoring Device


The Problem: Air and sound pollution have become a matter of great concern for us in recent years. Those who are living in cities in Asian countries have already realized how seriously air pollution has been poisoning life and degrading the environment. My motherland Bangladesh, one of the most densely-populated countries in the world, has been struggling with air and noise pollution for long. Dhaka, the country's capital, often finds its place among the most polluted cities in global indices.
Noise pollution has also become a significant problem in Bangladesh, especially in all the divisional headquarters where sound levels are far beyond the acceptable sound level for the human ear, according to a recent study by the Department of Environment (DoE). In Dhaka, the average sound level is 80-110dB in prime areas of Dhaka city which is almost twice the maximum noise level that can be tolerated by humans – 60dB – without suffering a gradual loss of hearing, according to the World Health Organization (WHO).
My Motivation on Making the Device: Very few works have been done on air quality and noise pollution measurements and estimation in Bangladesh. There is no adequate data available for research and analysis. One of the main reason is the lack of proper monitoring device. To solve the problem I am making this open-source noise and air pollution monitoring device so that anyone can make a device by himself. The pollution data is also open to all. By using the smartphone app anyone can get the Google Sheet of whole data from every device by email.
Features of the Project
- Record sound level, air quality, temperature, humidity and location of the device.
- Sends data to Ubidots and can be visualized from Ubidots dashboard.
- Data can be monitored from mobile app and anyone can get an excel sheet of full data through email from the mobile app.
- The device takes power from solar. No battery replacement or charging is required.
- Both Hardware & Software are opensource. Data is also open for all and can be helpful for analysis and research.
Supplies
1. Particle Argon (Buy from Particle)
2. Gravity: Analog Sound Level Meter (Buy from DFRobot) or Db detection module sound sensor (aliexpress.com)
3. Grove - Air quality sensor v1.3 (Buy from Seeed) or HDC1080 Digital Air Quality Sensor Module (buy from aliexpress.com)
4. Grove - Temperature & Humidity Sensor (DHT11) (Buy from Seeed) or (aliexpress.com)
5. Solar Power Manager 5V (Buy from DFRobot)
6. Monocrystalline Solar Panel (5V 1A) (Buy from DFRobot)
Step 1: How It Works


The brain of the device is a Particle Argon. The Argon is a powerful Wi-Fi enabled development board that can act as either a standalone Wi-Fi endpoint or Wi-Fi enabled gateway for Particle Mesh networks. It is based on the Nordic nRF52840 and has built-in battery charging circuitry so it’s easy to connect a Li-Po and deploy your local network in minutes. The Argon is great for connecting existing projects to the Particle Device Cloud or as a gateway to connect an entire group of local endpoints.
For collecting air quality, temperature, humidity and noise level several sensors are connected to Particle Argon. Argon collects the data from the sensors and uploads the data to the Particle cloud. Several web services were used for data visualization and analysis. All the web services are connected to Particle cloud through webhook. Ubidots was used to monitor and visualize the data from a browser, firebase was used to store the data and display the data to mobile app. Zapier was used to store data in a spreadsheet and the spreadsheet can be sent to any email address through IFTTT.
The device is powered from a 5W solar panel. Li-ion battery was used for storing solar energy and for charging the battery DFRobot 5V, 1A solar power manager was used.
Step 2: Preparing Grove Cable


Two Grove sensors were used for collecting air quality data and temperature and humidity data.
Seeed Grove - Air quality sensor v1.3: This sensor is designed for comprehensive monitor over indoor air condition. It's responsive to a wide scope of harmful gases, as carbon monoxide, alcohol, acetone, thinner, formaldehyde and so on. Due to the measuring mechanism, this sensor can't output specific data to describe target gases' concentrations quantitatively. But it's still competent enough to be used in applications that require only qualitative results, like auto refresher sprayers and auto air cycling systems.
Seeed Grove - Temperature & Humidity Sensor (DHT11): DHT11 is the most common temperature and humidity module for Arduino and Raspberry Pi. It is widely favored by hardware enthusiasts for its many advantages. E.g. Low power consumption and excellent long-term stability. Relatively high measurement accuracy can be obtained at a very low cost. The single-bus digital signal is output through the built-in ADC, which saves the I/O resources of the control board.
All grove sensor connect to other grove connectors through a grove cable. Unfortunately, the grove connector is not breadboarded friendly. To connect the grove sensor to the breadboard I cut the grove cable in the middle and each part was solder to the breadboard to connect two grove sensor.
For placing Argon board to the PCB instead of directly soldering the Argon board to the PCB I used female pin header so that Argon board can be easily unplugged from the PCB board.
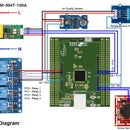
Step 3: Connecting With Jumper Wire


After soldering the grove cable into the PCB board and soldering the female pin header for Argon board we need to connect the grove sensor pins to the argon pins according to the schematic. I used extra jumper wire to connect the signal pins. For connecting the power pins same jumper wire was used.
GPS module and the analog sound level meter are connected with a male pin header to the PCB.
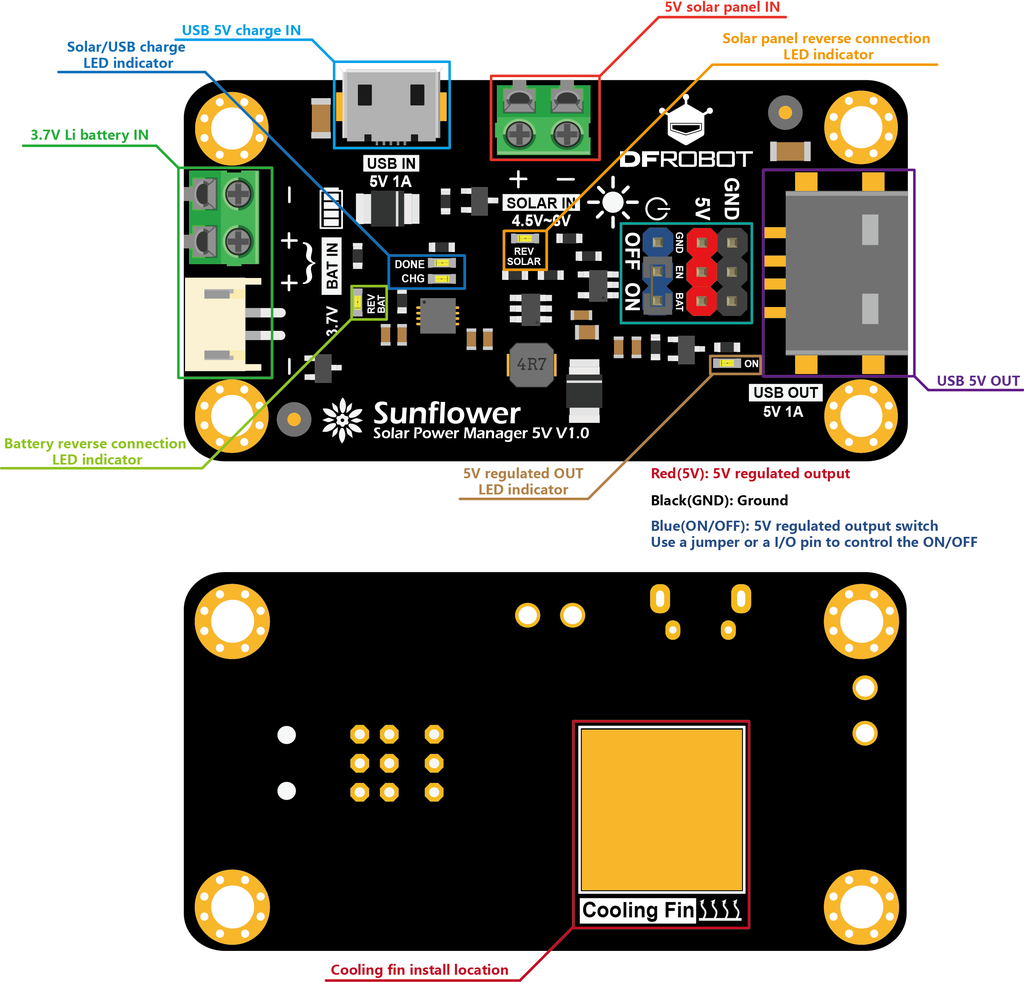
Step 4: Preparing Solar Power Manager


DFRobot Solar Power Manager 5V is a small power and high-efficiency solar power management module designed for 5V solar panel. It features as MPPT (Maximum Power Point Tracking) function, maximizing the efficiency of the solar panel. The module can provide up to 900mA charging current to 3.7V Li battery with USB charger or solar panel. The ON/OFF controllable DC-DC converters with 5V 1A output satisfy the needs of various solar power projects and low-power applications. The module also employs various protection functions for battery, solar panel, and output, which greatly improves the stability and safety of your solar projects.
The module came with a heat sink, 4 hax spacer with 4 screws. I placed the heat sink to the marked placed using the double-sided silicone tape. I also connected hax spacers to every hole using the screw.
Step 5: Placing the Sensors


Three sensors were used for making the device. Two grove sensors were discussed in a previous step. For collecting noise level Gravity analog sound level meter was used. This is an Arduino and Particle compatible sound level meter(also known as decibel meter, noise meter). It uses instrument circuit and low noise microphone, which enable it to accurately measure the sound level of the surrounding environment. This product uses instrument circuit, low noise microphone, which make it highly precious. It supports 3.3~5.0V wide input voltage, 0.6~2.6V voltage output. The decibel value is linear with the output voltage, which leads to a simple conversion, without complex algorithm. The connector is plug-and-play, without welding, so this product can be easily used in your application. It can be applied to environmental noise testing, such as highway noise monitoring station, bedroom noise monitoring, etc.
For placing all the sensor to the PCB board I used foam type double-sided tape. It is very easy to remove the device from the PCB board without damaging the sensor or any trace.
Step 6: Placing Power Manager Circuit & GPS


The NEO-6M GPS module is shown in the figure below. It comes with an external antenna and doesn't come with header pins. So, you’ll need to get and solder some.
- This module has an external antenna and a built-in EEPROM.
- Interface: RS232 TTL
- Power supply: 3V to 5V
- Default baud rate: 9600 bps
- Works with standard NMEA sentences
The NEO-6M GPS module is also compatible with other microcontroller boards. The NEO-6M GPS module has four pins: VCC, RX, TX, and GND. The module communicates with the Arduino via serial communication using the TX and RX pins, so the wiring couldn’t be simpler:
Neo 6 GPS is also connected through double-sided tape. For placing Power manager I used screw. Do not use any tape for the power manager because it produces enough head and you should keep some space to circulate air to protect it from damage.
Step 7: Connecting the Wires


One big advantage of using DFRobot solar power manager is that it can provide power to other devices directly through USB cable. So, you can directly connect the Argon board to the power manager circuit through a USB cable. Another advantage is that you can also connect the solar panel to the charger circuit through a USB cable. So no jumper wire or soldering is required.
The solar panel used in the project is a high-performance, lightweight, portable monocrystalline silicon solar panel in a PET package, with an integrated voltage regulator output of 5V, with working indicators, USB type-A mother-port output, plug-and-play. It can supply plenty of power in various environments to prevent the system from shutting down, even in rainy days. The energy of solar panel will be particularly efficient when paired with the DFRobot solar power management board. The panels are provided with open holes and copper clasps so that they can be attached directly to the backpack for easy portability and use. The ultra-thin, lightweight design weighs just 90g. It's much lighter than a solar panel in a traditional glass package.
Step 8: Making Battery Connection


Energy harvested from solar is stored in two parallel-connected li-ion rechargeable battery. Parallel connections will increase your current rating, but the voltage will stay the same. In the “Parallel” connection, 2 3.7 volts battery will give 3.7V output, but the amps increase to 2 times. It's important to note that because the amperage of the batteries increased, you may need a heavier-duty cable to keep the cables from burning out.
To join batteries in parallel, use a jumper wire to connect both the positive terminals and another jumper wire to connect both the negative terminals of both batteries to each other. Negative to negative and positive to positive. You CAN connect your load to ONE of the batteries, and it will drain both equally. However, the preferred method for keeping the batteries equalized is to connect to the positive at one end of the battery pack, and the negative at the other end of the pack.
The solar power manager can charge two cells in four hours from a 5W solar panel. The battery is connected to the green connector specific for battery input. An spdt switch was used for giving on/off option for the circuit.
Step 9: Making Enclosure


The enclosure is important for any outdoor devices to protect rain and other environmental hazards. I choose plywood for making the encloser. You may use a 3D printed enclosure. 7 pcs of plywood were required to make a complete box.
Two pcs of the plywood had a 60-degree angle cut. This is the average tilt angle in my city Dhaka. The top part has a hole to bring out USB cable from the panel.
Wood epoxy solution and nail was used to attached different wood pieces together. You can use sandpaper to get a finished look. You can make any size of enclosure which one is convenient but be sure you have enough space to put your circuit board inside the box. You should also allow air and sound inside the box for accurate sensor reading.
Step 10: Placing Solar Panel


The placement and orientation of solar panels is just as important as which type of solar panel is used in a given situation. A solar panel will harness the most power when the Sun's rays hit its surface perpendicularly. Ensuring that solar panels face the correct direction and have an appropriate tilt will help ensure that they produce maximum energy as they are exposed to the highest intensity of sunlight for the greatest period of time.
In the northern hemisphere, the general rule for solar panel placement is, solar panels should face true south (and in the southern, true north). Usually, this is the best direction because solar panels will receive direct light throughout the day. However, there is a difference between the magnetic south and true south that must be considered. Magnetic south is the "south" shown when a compass is used, and this south points to the Earth's south magnetic pole. Solar panels, however, need to face solar or geographic south, which is the direction towards the South Pole. By the same reasoning, if the solar panel is located in the southern hemisphere, the panel should instead face in the direction of true north.
The angle or tilt of a solar panel is also an important consideration. The angle that a solar panel should be set at to produce the most energy in a given year is determined by the geographical latitude. A general rule for optimal annual energy production is to set the solar panel tilt angle equal to the geographical latitude. For example, if the location of the solar array is at 50o latitude, the optimal tilt angle is also 50o. Essentially, the closer a solar panel is located to the equator the more the panel should be pointing straight up. The closer the panel is to the poles, the more they should tilt towards the equator.
The angle of solar panels can also influence the power output due to climatic and environmental factors. In northern climates, snow accumulation on low-tilt panels can reduce or completely block the Sun's rays from reaching the solar panel during the winter months.
Step 11: Placing the Device Inside the Enclosure


After making the box it is the time to place the circuit board inside the encloser. After placing the circuit board at the bottom part I add screws to fix the circuit with the box. The GPS antenna and the wifi antenna was placed fixed using hot glue.
Step 12: Developing and Burning the Firmware

The program for the device was developed using Particle Web IDE. To develop a program using Particle web IDE you need to log in particle console. After login open a new project and paste the following code:
//All external libraries are added here
#include "Particle.h"
#include "Adafruit_DHT.h"
#include
#include "Arduino.h"
#include


#define DHTPIN 2     // what pin DHT11 sensor is connected to
#define DHTTYPE DHT11		// Type of DHT sensor
#define SoundSensorPin A1  //this pin read the analog voltage from the sound level meter
#define VREF  5.0  //voltage on AREF pin, default:operating voltage

//Object declaration for DHT sensor
DHT dht(DHTPIN, DHTTYPE);

//Object declaration for air quality sensor
//AirQuality airqualitysensor;

//Object declaration for GPS
TinyGPSPlus gps;

//Global variables for the sensor data
char air_quality[20] = "";
float temperature = 0.0;
float humidity = 0.0;
float dbValue = 0.0;
float latitude = 0.0;
float longitude = 0.0;

float startTime;

int current_quality =-1;

bool requestSent = false;
void hookResponseHandler(const char *event, const char *data);


void setup() {

	Serial1.begin(9600);      //default buad rate for NEO-6M gps is 9600
	dht.begin();              //initialize dht sensor
	airqualitysensor.init(A0);//initialize air quality sensor
	//receive response after publishing data to particle cloud
	Particle.subscribe("hook-response/Ubidots", hookResponseHandler, MY_DEVICES);
	startTime = millis();     //time count start
}

void loop() {
    if (millis() > startTime + 30000) {    //publish data every 30 second
       startTime = millis();
	   //all the global variables are automatically updated on functions call
       read_dht_value();
       read_air_quality();
       read_sound_level();
       publish_data();
       delay(1000);
    }

    while (Serial1.available() > 0){
       if (gps.encode(Serial1.read())){
           if (gps.location.isValid()){
              latitude = gps.location.lat();    //get latitude and longitude
              longitude = gps.location.lng();
           }
           delay(10000);  //Check for gps data every 10 seconds
       }
    }

}

void hookResponseHandler(const char *event, const char *data) {
	float elevation = atof(data);
}

//this function reads temperature and humidity from dht11 sensor
void read_dht_value() {
    //Reading temperature or humidity takes about 250 milliseconds!
    //Sensor readings may also be up to 2 seconds 'old' (its a
    // very slow sensor)
	float h = dht.getHumidity();
    //Read temperature as Celsius
	float t = dht.getTempCelcius();
    // Check if any reads failed and exit early (to try again).
	if (isnan(h) || isnan(t)) {
		return;
	}
    else {
        temperature = t;
        humidity = h;
    }
}

//this function reads the quality of the air
void read_air_quality()
{
    current_quality=airqualitysensor.slope();
    if (current_quality >= 0)// if a valid data returned.
    {
        if (current_quality==0)
            air_quality = "Very High pollution";
        else if (current_quality==1)
            air_quality = "High pollution";
        else if (current_quality==2)
            air_quality = "Low pollution";
        else if (current_quality ==3)
            air_quality = "Fresh air";
    }
}

//interrupt service routine for air quality sensor
ISR(TIMER2_OVF_vect)
{
    if(airqualitysensor.counter==122)//set 2 seconds as a detected duty
    {
        airqualitysensor.last_vol=airqualitysensor.first_vol;
        airqualitysensor.first_vol=analogRead(A0);
        airqualitysensor.counter=0;
        airqualitysensor.timer_index=1;
        PORTB=PORTB^0x20;
    }
    else
    {
        airqualitysensor.counter++;
    }
}

// This function read the data from sound sensor and convert the value into decibel.
void read_sound_level()
{
    float voltageValue;
    voltageValue = analogRead(SoundSensorPin) / 1024.0 * VREF;
    dbValue = voltageValue * 5.0;  //convert voltage to decibel value
}


void publish_data(){
    char data[256];
	char data1[256];
	//I made two data array because ubidots required position value with a context, firebase doesn't
    snprintf(data, sizeof(data), "{\"position\": {\"value\":1, \"context\":{\"lat\": %.6f, \"lng\": %.6f}}, \"temp\":%.2f, \"noise\":%.2f, \"air\": {\"value\":1, \"context\":{\"quality\": \"%s\"}}, \"humid\":%.2f}",
    latitude, longitude, temperature, dbValue, air_quality, humidity);

    snprintf(data1, sizeof(data1), "{\"lat\": %.6f, \"lng\": %.6f, \"temp\":%.2f, \"noise\":%.2f, \"air\":\"%s\", \"humid\":%.2f}",
    latitude, longitude, temperature, dbValue, air_quality, humidity);

    Particle.publish("Ubidots", data, PRIVATE);  //trigger webhooks for Ubidots
    Particle.publish("Google_Sheet", data1, PRIVATE); //trigger webhook to Zapier for uploading to Google Sheet
	Particle.publish("Firebase", data1, PRIVATE);  //Store data to firebase
	Particle.publish("Firebase_put", data1, PRIVATE); //Update data to firebase.
	//The main difference here is that the requestType is PUT, not POST. The PUT method doesn't create a table of values;
	//it just creates a single element to hold the data, overwriting any previous data at that location.
}
Step 13: Configuring Particle Webhook for Ubidots


Several web services are used in the project. I used Ubidots for visualizing data, Firebase real-time database for storing the data and accessing the data through smartphone app, Zapier for making a Google Sheet using the data and IFTTT for sending the Google Sheet to user's email. All the web services are connecting to Particle cloud through Webhook.
A webhook (also called a web callback or HTTP push API) is a way for an app to provide other applications with real-time information. A webhook delivers data to other applications as it happens, meaning you get data immediately. Unlike typical APIs where you would need to poll for data very frequently in order to get it real-time. This makes webhooks much more efficient for both provider and consumer. It is very easy to configure webhook for Particle device using Particle console. In next few steps I will show you how I configured webhook for different web services used in this project.
To begin your Particle - Ubidots connection, first you will need to setup your Particle device (Argon, Photon, Core, or Electron) within your particle account. Click here for simple steps to setting up your device with Particle's device platform.
You will also be required a Ubidots account. Ubidots allow free account for education and provides 5000 Credits for free.
Step 1: Create a Ubidots account from https://ubidots.com/education/ and log in to your account.

Step 2: From the right corner click on API Credentials and note the default token.

Step 3: Log in to your Particle account
Step 4: Go to your particle console and choose Integrations and click on "New Integration" 
Step 5: Select "Webhook" 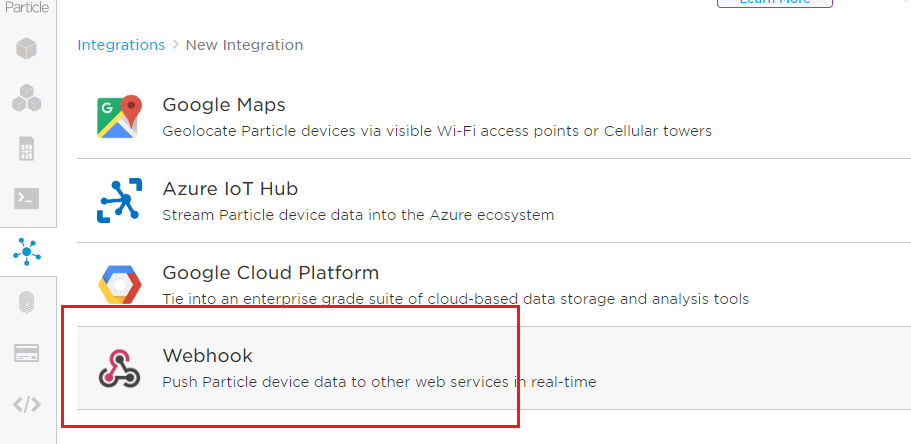
Step 6: Give an Event Name (1). This name must be same as the event name of Perticle.publish() method for Ubidots. I put the name as "Ubidots".

<a href="https://things.ubidots.com/api/v1.6/devices/{{PARTICLE_DEVICE_ID}}/?token=" your"="">https://things.ubidots.com/api/v1.6/devices/{{PART...</a> DEFAULT TOKEN FROM UBIDOTS CREDENTIALS"
We're going to automatically call and assign the Device ID of the Particle Device to ensure the device label in Ubidots remains unique. To do this we're going to use the pre-defined key available from Particle:{{{PARTICLE_DEVICE_ID}}} This call will automatically assign to the URL the ID of the device which triggered the webhook.
Other fields should be the same as shown in the figure.
Step 8: Select "ADVANCED SETTING" and complete the text editor with the following text:

Note: For configuring all the web services used in this project follow the link: https://www.hackster.io/taifur/urban-noise-air-pollution-monitoring-d14088
Step 14: Configuring Webhook for Firebase (Real Time Database)


Firebase Realtime Database is a cloud-hosted database that supports multiple platforms Android, iOS and Web. All the data is stored in JSON format and any changes in data, reflects immediately by performing sync across all the platforms & devices. This allows us to build more flexible realtime apps easily with minimal effort.
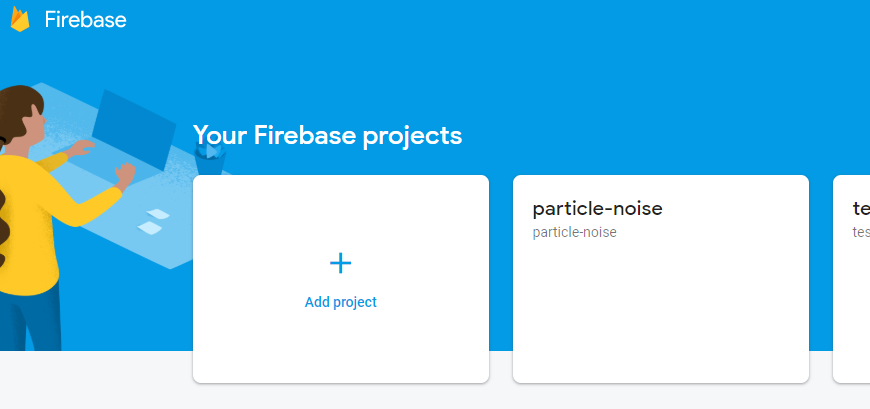
Step 1: Log in to Firebase console console.firebase.google.com/console/loginusing your Gmail account. Click on "Add Project".
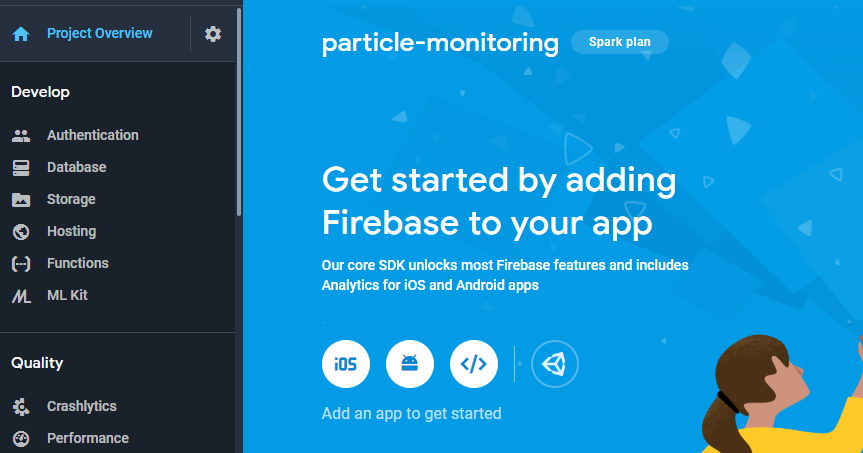
Step 2: Give a project name and accept the terms and click to "Create Project".

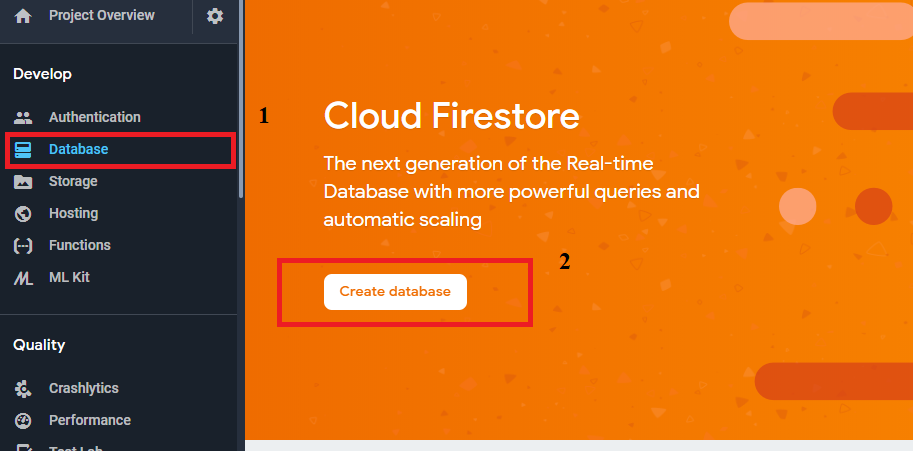
Step 3: After creating project go to Database tab and select Create database.
Step 4: Choose Start in test mode and click to Next.
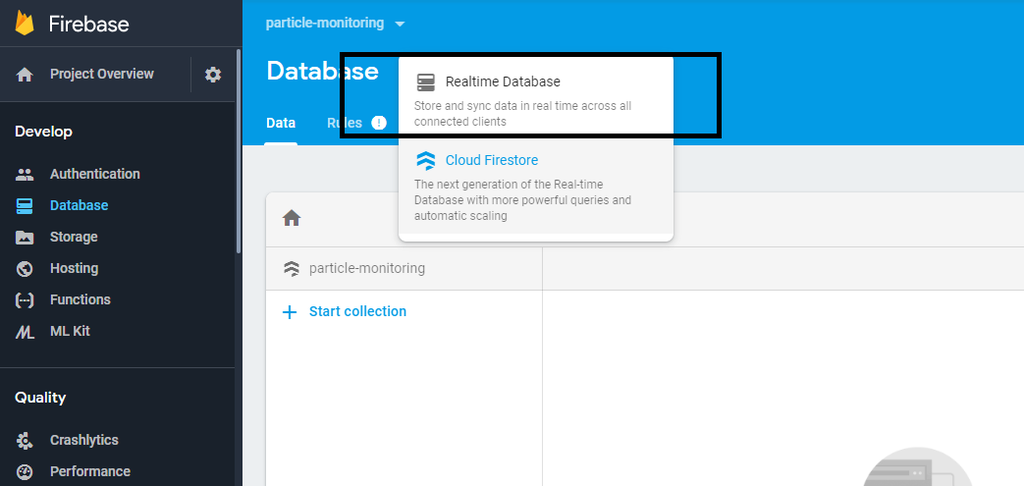
Step 5: From Database drop down choose Realtime Databse.

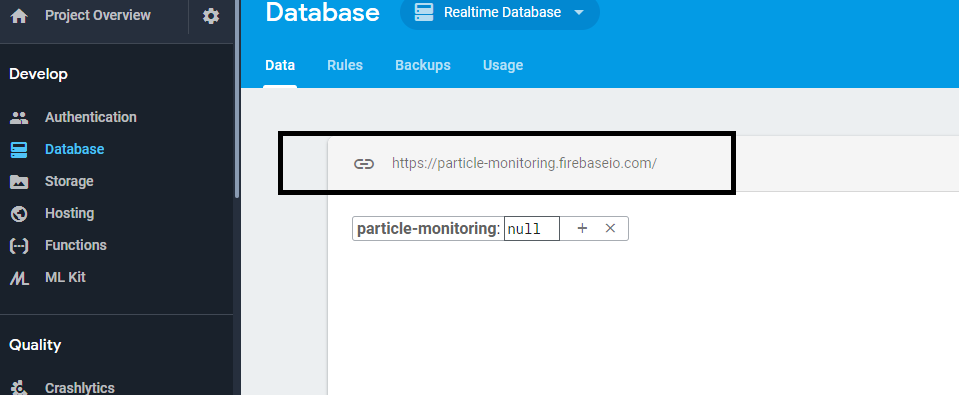
Step 6: Note the URL of the database. It will be required later on configuring Webhook from Particle console as well as making Android app.
Step 7: From the Rules tab set read and write permission as true.
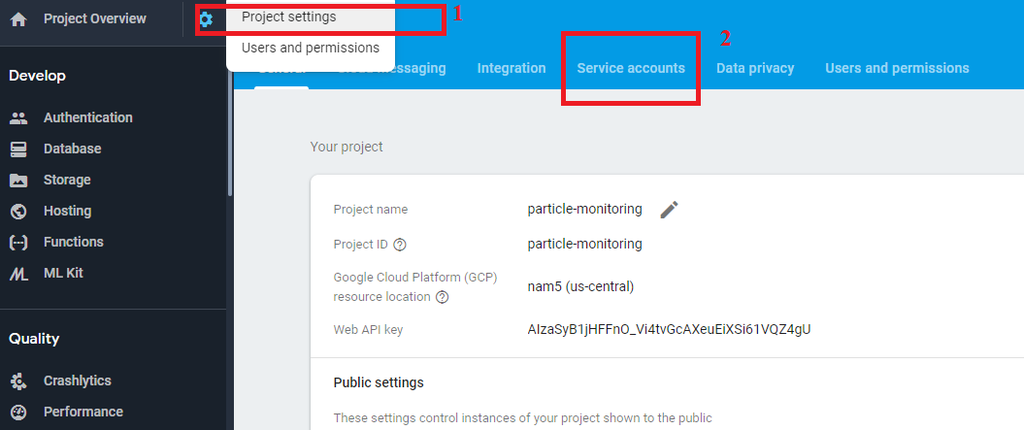
Step 8: Go to Service accounts.

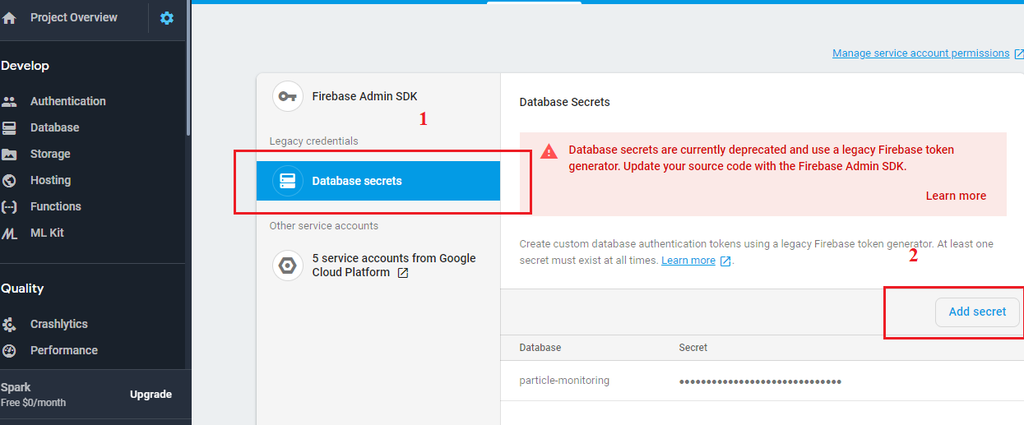
Step 9: Select Database secrets.
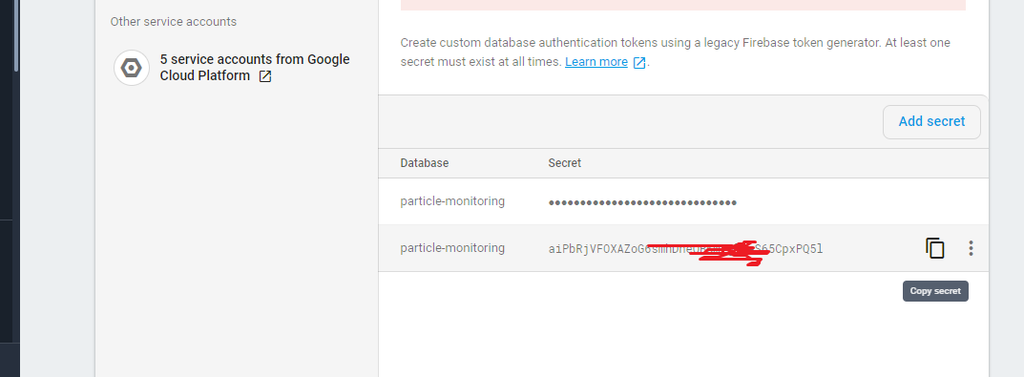
Step 10: Click on Add secret and copy it.

Step 11: Go to Particle console and from the integration start a new webhook integration. Fill up all the fields as follows. Replace URL with your own URL.
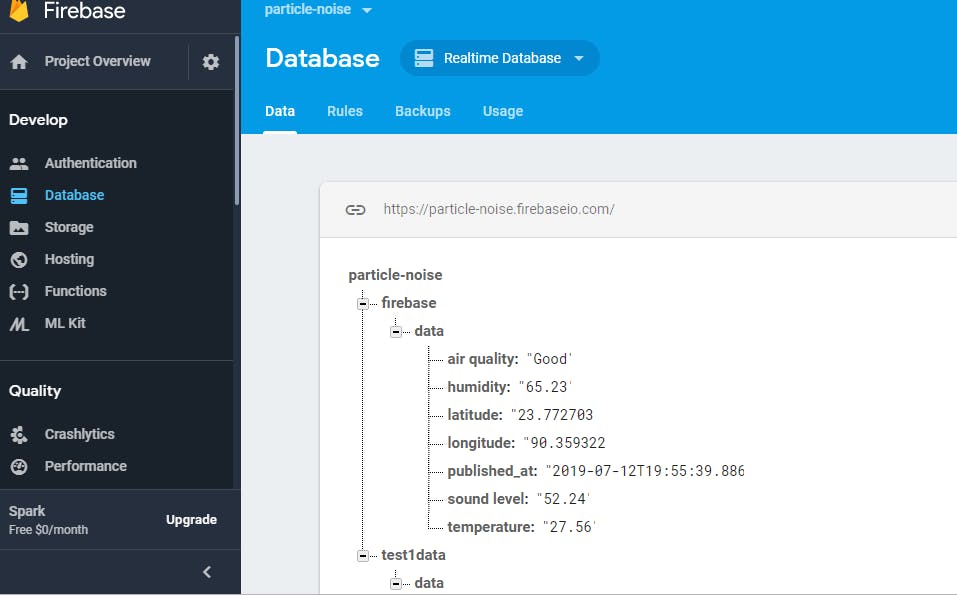
Step 12: Click on Advanced Settings, choose Custom option and paste the following json code:
{
 "temperature": "{{temp}}",
 "humidity": "{{humid}}",
 "air quality": "{{air}}",
 "sound level": "{{noise}}",
 "latitude": "{{lat}}",
 "longitude": "{{lng}}",
 "published_at": "{{PARTICLE_PUBLISHED_AT}}"
}
Sensor data will be sent to Firebase as this JSON data. It will look like following.
Finally, click on Create webhook to make it final. Webhook for Firebase is now ready.
Step 15: Configuring Particle Webhook for Zapier


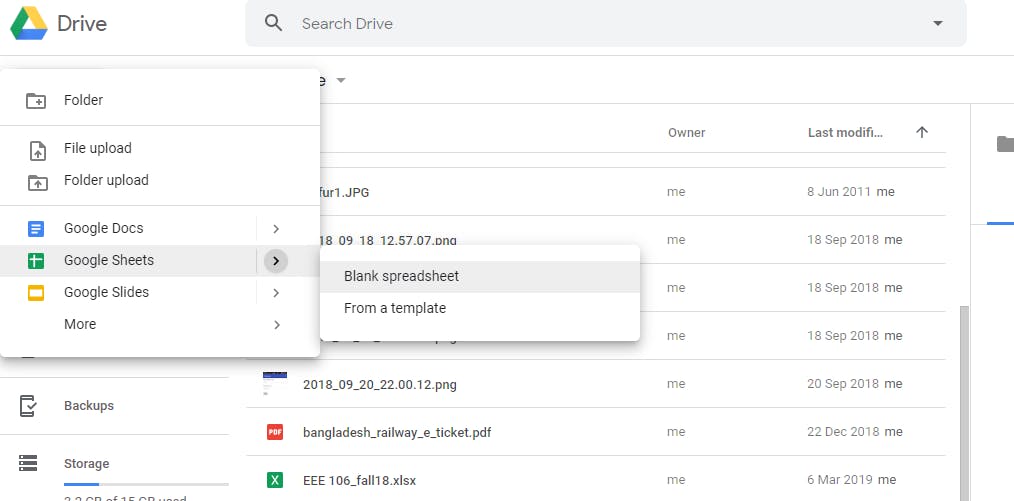
Zapier will be used to save the Particle data to a Google Sheet. Every time a new data will be published to the Particle cloud, Zapier will create a new row in the Google Sheet and fill the columns with the appropriate data value. To do this we first need to make a Google Sheet in Google Drive.
Step 1: Go to your Drive and start with a Blank spreadsheet.
Step 2: First row will be the name of the data field (column). Put the name of every column according to your data. In second row just put a sample value for every data. It will help Zapier to identify the data field correctly. 
Step 3: Go to https://zapier.com/ and login if you have already created an account. Otherwise create the account first. Start a new Zap. From the connect this app... dropdown choose Webhooks by Zapier and from with this one! dropdown select Google Sheets. 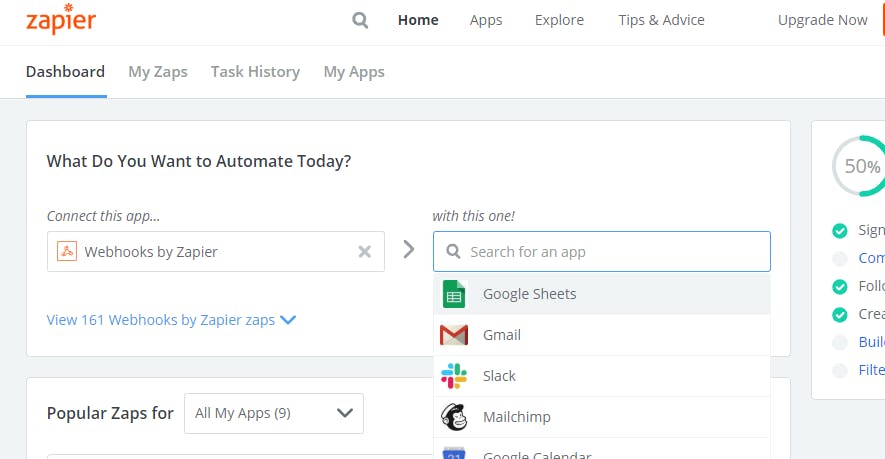
Step 4: Click on Make a Zap! 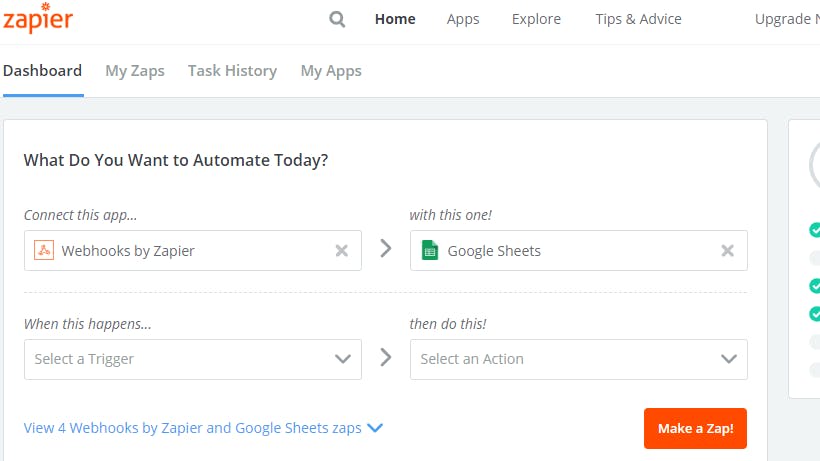
Step 5: Choose Catch Hook and click on Save+Continue. 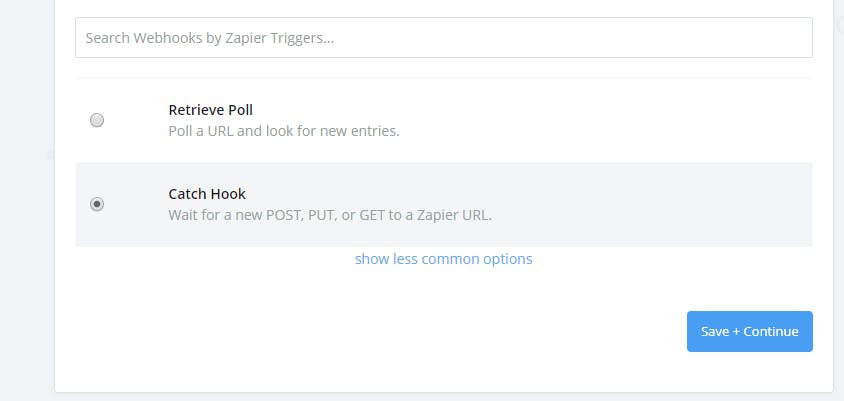
Step 6: A unique webhook URL will be created for you. Copy the URL to the clipboard. Without closing the tab open a new tab form the browser and open Particle console.
Step 7: Initiate a new webhook creation from the integration tab. 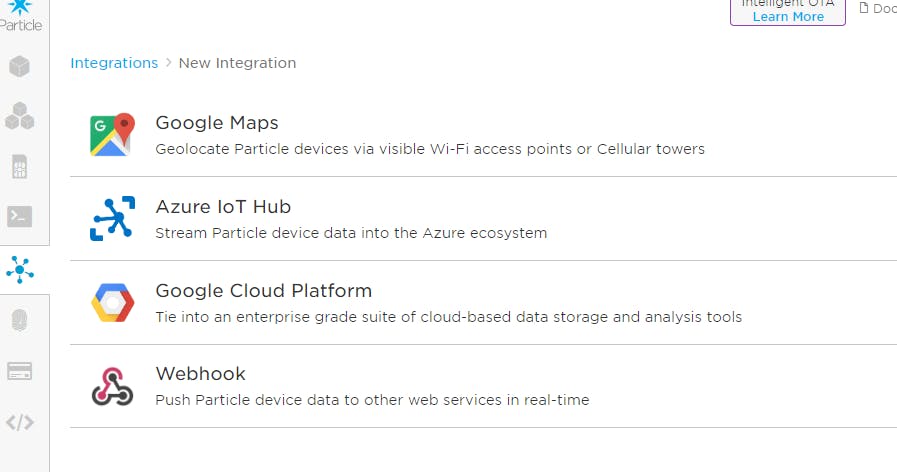
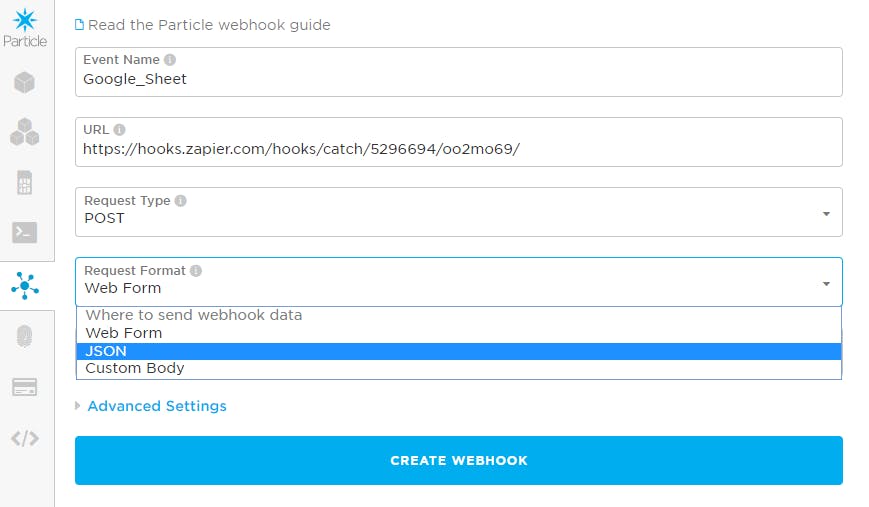
Step 8: Fill up all the field. Paste the Zapier webhook URL to URL text box form the clipboard. For the Request Format select JSON.
 Step 9: From the Advanced Setting select Custom option and paste the following JSON code on the text box. This JSON is same as you used for Firebase.
{
 "temperature": "{{temp}}",
 "humidity": "{{humid}}",
 "air quality": "{{air}}",
 "sound level": "{{noise}}",
 "latitude": "{{lat}}",
 "longitude": "{{lng}}",
 "published_at": "{{PARTICLE_PUBLISHED_AT}}"
}

Step 10: Click on CREATE WEBHOOK 
Step 11: After creating the hook click on TEST to send a test request to Zapier. 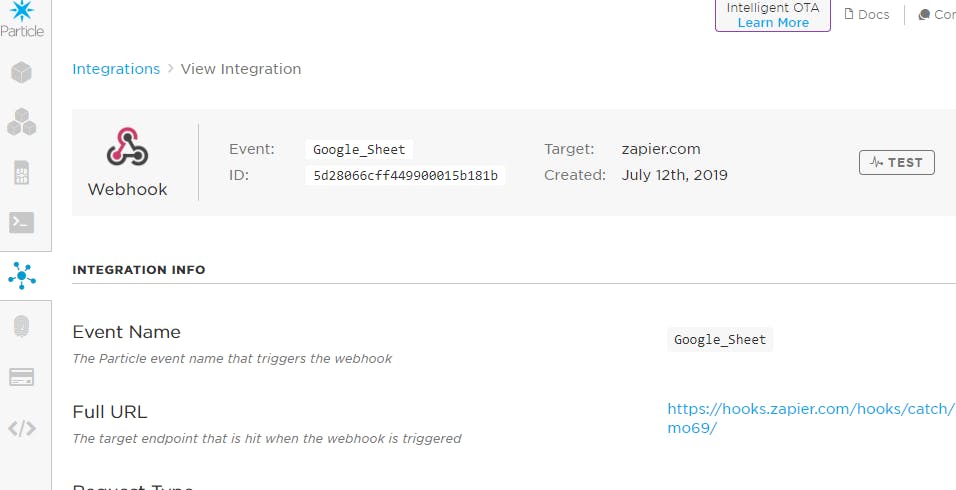
If everything goes well you will get the following message. 
Step 12: Go to the previous tab from browser and click on Ok, I did this button as you sent a test request from Particle cloud. 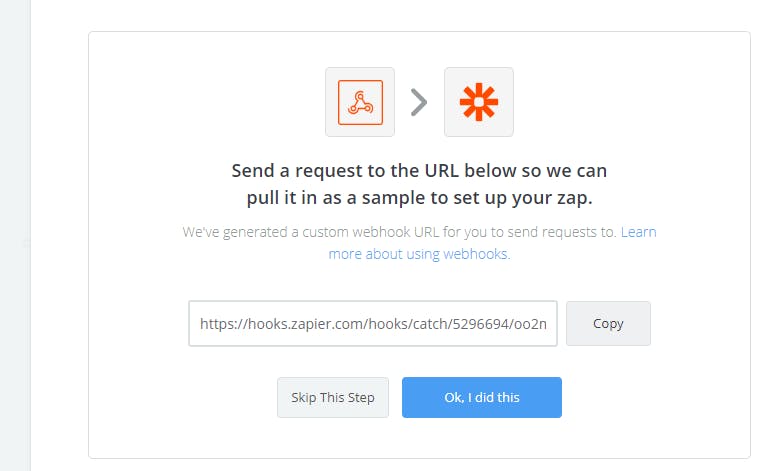
Step 13: Select Hook A and click on Continue to go to ACTION tab. 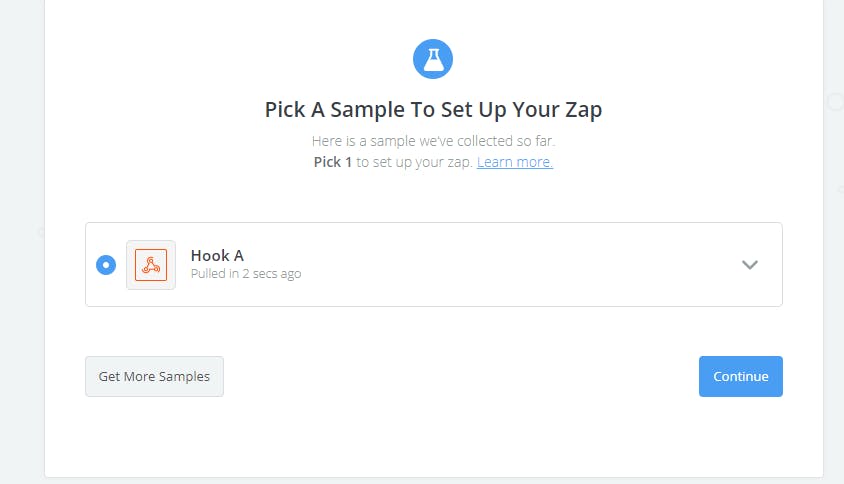
Step 14: Choose Google Sheets as your apps. 
Step 15: From the Google Sheets Action select Create Spreadsheet Row as we like to save all value in a single sheet. 
Step 16: Choose the google account for the Sheet and click on Save+Continue. 
Step 17: From the Spreadsheet dropdown select the sheet you have already created for this purpose. 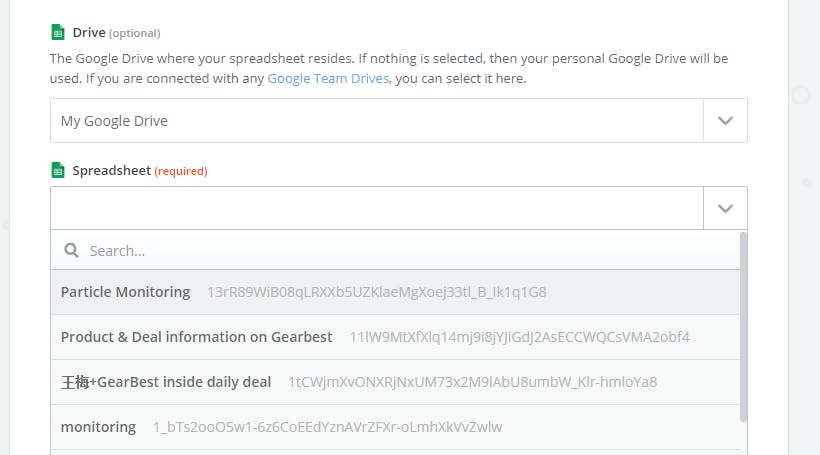
Step 18: Select Sheet1 for Worksheet field. You will see all the column field you created on the Sheet. 
Step 19: Choose the appropriate variable for every column field from Insert a Field option. You will find all the variables from the dropdown you sent earlier as a test request from Particle cloud. 
Step 20: Do the same for all fields and click on Continue. 
Step 21: Click on send Test To Google Sheets to test either it is working or not. 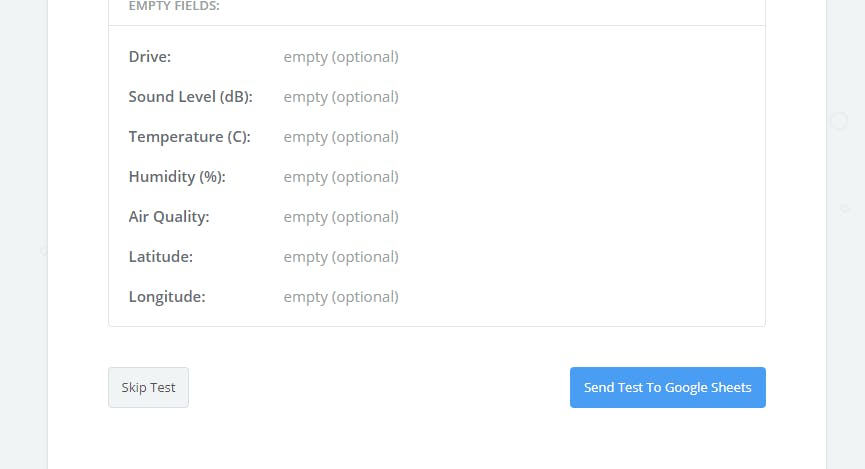
Step 22: If everything goes well you will get a successful message. 
Step 23: Open the Sheet from the Drive and you will see a new row has created. Without time all other fields are empty because we didn't sent any value on test request.

Step 24: Click on Finish 
Step 25: Finally turn on the Zap. 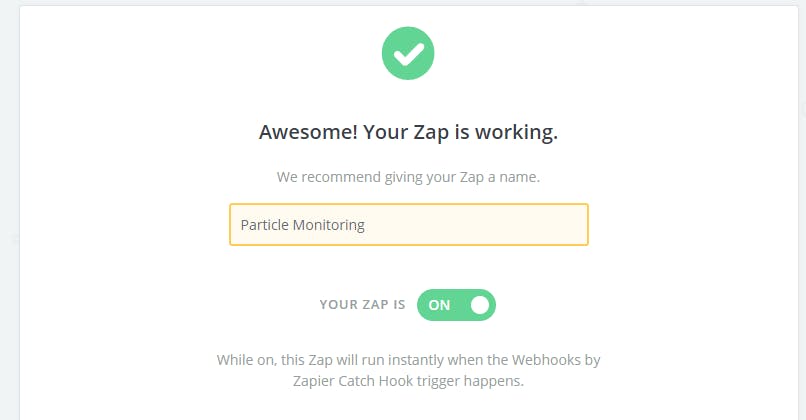
Step 16: Configuring IFTTT for Sending Email


IFTTT will be used to send the Google Sheet to the user email who like to get it. It will trigger from the Android apps.
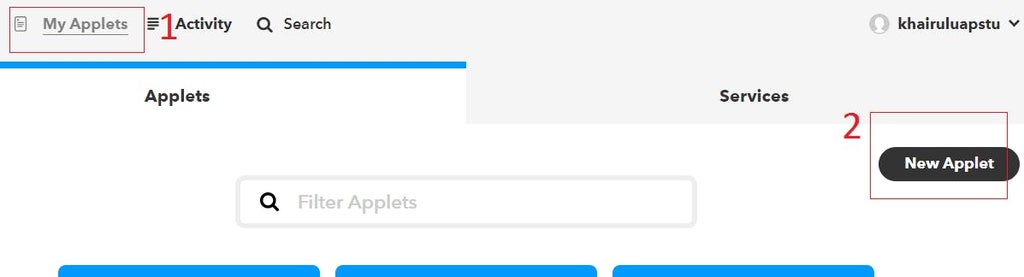
Step 1: Login to IFTTT account and click to My Applets. Click on New Applet.
Step 2: Click on +this.

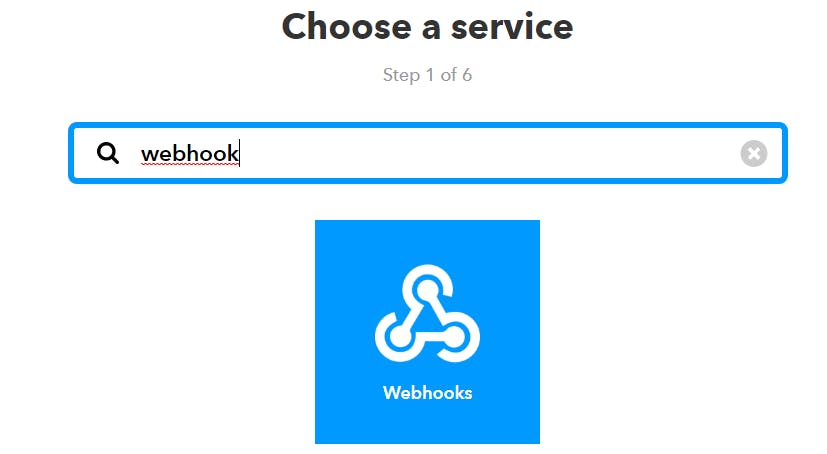
Step 3: Search for webhook and select when it appears.
Step 4: Continue with Receive a web request.

Step 5: Put an Event Name and click on Create trigger.  Step
Step
Step 6: Click on +that

Step 7: Choose Gmail as action service. 
Step 8: Choose to Send an email 
Step 9: For To address field add Value 1 from Add ingredient 
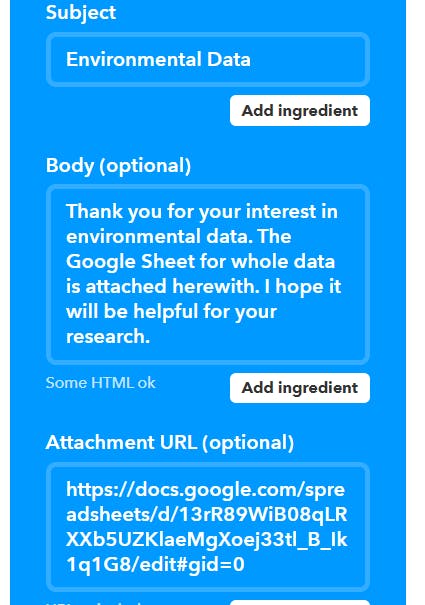
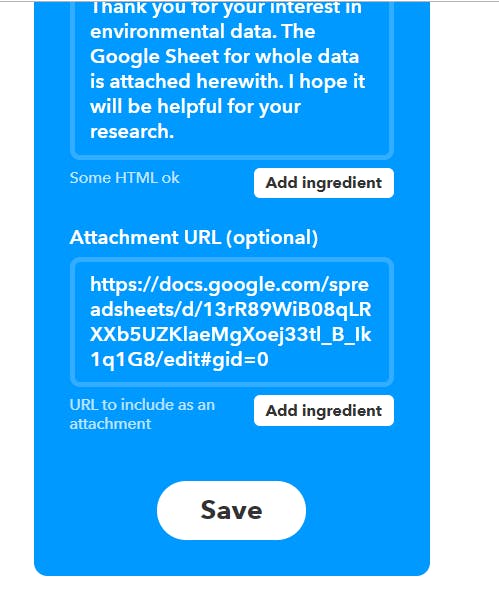
Step 10: Fill Subject and Body with your requirement. Paste the link of the Google Sheet for the text box Attachment URL. This file will be attached with the email.
Step 11: Click to Save to create the Applet.
Step 17: Developing Android App Using MIT App Inventor


In this stage, we will build an Android application for monitoring data from a smartphone. A user will also be able to send a request for sending the data to his/her email.
Making an app using MIT App Inventor is very easy. No coding is required. We will read data from firebase using the app. MIT App Inventor has a built-in extension for interacting with firebase. We just need to add the extension in our project.
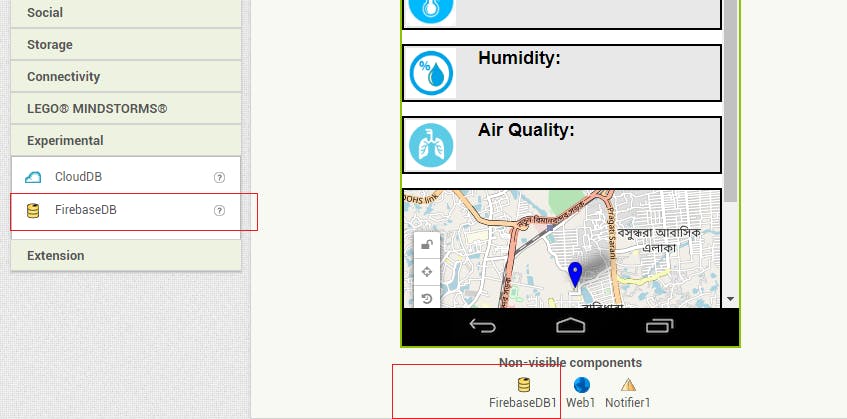
For working with firebase you will be required your firebase URL (same URL we use in configuring webhook), the firebase token and the bucket name. Bucket name is actually the table name in firebase.

Block editor explains the interaction between different UI elements. Firebase.DataChanged method triggered for every new data uploaded to firebase. The change reflected in the app in real-time.

For sending the email IFTTT maker channel is used. User will put his email address in the text box and click on send button. The following block will be triggered and IFTTT channel will receive the webhook request to send the email to the address given by the user.

Complete source code and apk file are attached below. You can download the source, import it to your app inventor account and modify it as your requirement.
Attachments

Step 18: The Result


The configuration of web services is will be discussed in the next section. When you finished the configuration upload the firmware and power up the device. You will observe the following result from Ubidots device tab:

If you configure any dashboard you can observe the data in a graph like the following image.

Air quality and GPS data are sent as Context. Air quality data context are as follows.

You will observe the following output from Firebase console. This is for the PUT method configure in webhook. Without creating any row data is just update.
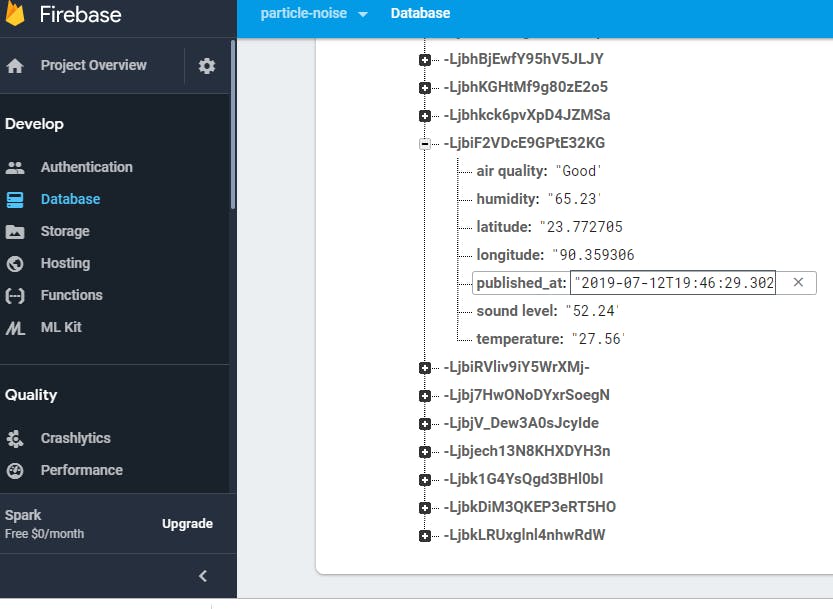
The following result is observed for the POST request. Every time firebase receives new data it stores in a new row. This may be helpful if you like to export the data.
Zapier saves the data in Google sheet and for every data received, a new row is created. You can also show the graph on the sheet.

The view of the android app will be as follows.
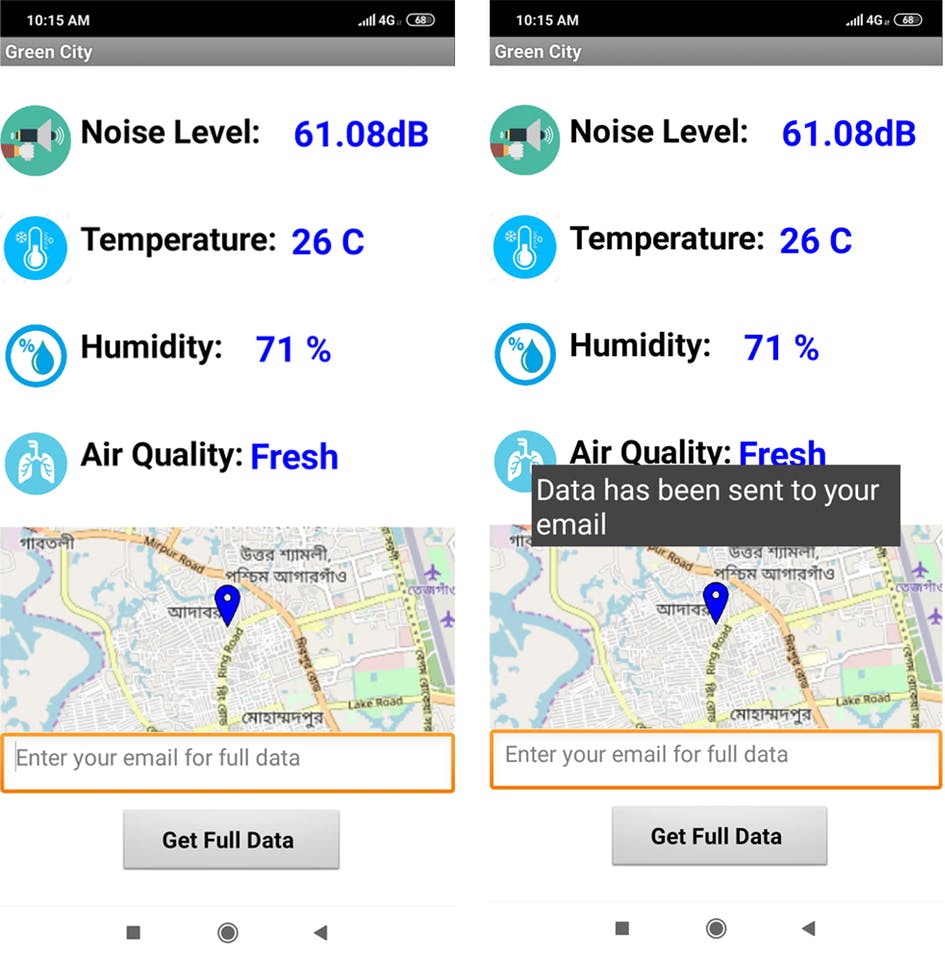
If the user sends a full data request he will receive an email and the received email will look like the following:


Second Prize in the
Sensors Contest