Introduction: Arduino Wireless Plotting With Nrf24l01 and Mat Plot.py


This is a small project that can help you in wireless transmission of your data from one end to another and it can be two way too but in this case i have only practiced 1 way communication and then plotting of the data using python too ... in this case i have transferred the data of a gyroscope (MPU 6050). But this way any sensor or any kind of data will work.
Supplies
MPU 6050 3 axis gyroscope (x2)
NRF 24L01+ pa lna (x2)
Arduino nano (x2)
LD33v (x2)
Step 1: Wiring


DONT connect 5v input from the arduino nano to the power of nrf24L01 (ntf24l01 is not 5v tolerant max voltage is 3.6v )
Arduino cannot power the nrf24L01+ as the max current arduino can give out is 50ma and the minimum power nrf24l01 is about 45 ma and can extend up to 100ma so we will have to use a external power supply .. i have used a usb wire with a LD33v voltage regulator. 2 capacitors are also being used one on the input of the LD33v 100μF and one on the output of LD33v (input of nrf24L01) 10μF to give some extra juice as the nrf24l01 is very power hungry.
The receiver is the same circuit as the transmitter the only difference is that it doesnt have the gyroscope for obvious reasons
Image 1 - transmitter
Image 2 - receiver
Step 2: Transmitter Code


I will be using the RF24 library by TMRh20 : https://github.com/nRF24/RF24
l will be explaining only the transmission and the plotting part but if u are willing to understand the calculation of the code from the gyroscope Joop brokking has done it brilliantly a link to his video :
Please watch the video above to completely understand the IMU (inertial measurement Unit)
#define CE 9 // CE pin
#define CSN 10 // CSN pin
float dataTx[2] ; // make 2 floats so we can transfer the gyro data
const uint64_t pipe = 0xE8E8F0F0E1LL; // make a unique address and use it as a pipe to send data
RF24 radio(CE ,CSN); // make "radio" and define the CE and CSN pin
radio setup : should be in void setup
radio.begin(); // start radio
radio.setDataRate( RF24_250KBPS ); // set data rate (needs to match on the transmitter 250kb/s radio.setPALevel(RF24_PA_MIN); // set to min power consumption (for close distances)
radio.begin(); // start radio
radio.openWritingPipe(pipe); // open the pipe for communication with the other node
Transmission loop :
dataTx[0] = pitch ; //Append data (pitch)from calculated gyro to data int
dataTx[1] = roll ; //Append data (roll)from calculated gyro to data int
radio.write(dataTx,sizeof(dataTx)); //Transmit the data to the reciever
Serial.print("x = "); //Print in Serial so we know that its still transmitting
Serial.print((dataTx[1]); //Print in Serial so we know that its still transmitting
Serial.print(". y = "); //Print in Serial so we know that its still transmitting
Serial.println((dataTx[0]); //Print in Serial so we know that its still transmitting
Attachments

Step 3: Receiver Code
The receiver's job is to receive the gyroscope data sent from the transmitter and send it to the serial port from which the python program will run to plot it.
float data[2];
RF24 radio(9,10);
const uint64_t pipe = 0xE8E8F0F0E1LL; //common adress which the receiver will send to (acts like a pipe)
void setup(){
Serial.begin(115200); radio.begin(); //Start the nRF24 communicate
radio.openReadingPipe(1, pipe); // Opens the pipe in which the transmitter is sending the code radio.startListening(); //Start listening }
void loop(){
if (radio.available()){ //if transmitter is sending data
radio.read(data, sizeof(data)); //read the data , size of data
Serial.print (data[1]); //print the data (roll) so that python can pick it up
Serial.print (',') //this comma will act out as a divider for axises a
Serial.println (data[0]); //print the data (pitch) so that python can pick it up } }
Attachments
Step 4: Python Code


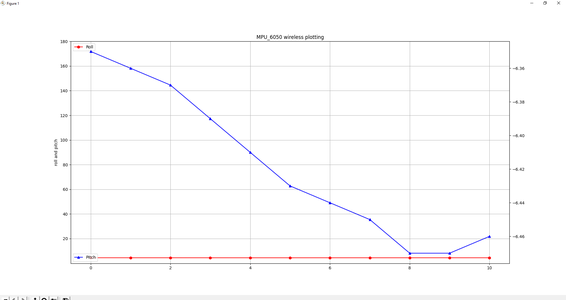
This is the code which will be running in python workspace on the receiving devices end, it will take all the data which the receiver is receiving from the transmitter and dumping it in the serial port. It will then convert the string to a actual value (float) and then use the floats to plot it down .
This is the code which will be running in python workspace on the receiving devices end, it will take all the data which the receiver is receiving from the transmitter and dumping it in the serial port. It will then convert the string to a actual value (float) and then use the floats to plot it down .
Brief explanation of the code :
1.import all the libs (serial,matplot,drawnow,time)
2.make empty lists to store the data coming
3.define interactive plotting as we will be plotting live data (plt.ion)
4. Open the serial port at COMX and baudrate x as 'ser' (use respective com port and baud rate (choose high))
5.define a int counter too count incoming data (cntr)
6.sleep for 5 secs to give time for the receiver and transmitter to setup
7.define bunch of code to plot the data
This is all to make the plot better plotting happens at plot.plt2 and plot.plt
- set y lim (plt.ylim(min,max))
- set title (plt.title(my title))
- turn on gird(plt.gird(True))
- set y label (plt.ylable)
- plot roll(plt.plot)
- make legend (plt.legend)
- define another plot2=plt2twinx
- plot plt2(plt2.plot)
- make legend (plt2.plot) dissable auto scalling (pl2.ticklabel_format)
8. while True (runs infinitely)
- 1.read data from 'ser'
- 2.split the string into dataArray[1] and dataArray[0] containing x and y
- 3.implement the split string into 2 different floats (roll(x) and pitch(y))
- 4.Set the delay to pause the plot to avoid crashing and continuous data transfer (time.sleep)
- 5.print all data (print)
- 6.append the x and y values into roll and pitch (roll.append)
7.cntr + 1 so that we can count the loops (cntr = cntr +1)
8.Draw the plot (drawnow(plotData))
9.if cnter>30 then remove the last data from the last index (roll.pop(0)), This is so that the data keeps flowing
10.reset the counter after this loop (cntr = 0), after a loop(30 index) reset the counter
In line 9 you will have to change the COM port according to your device port, you can check your device's COM port in "device manager"
Please check the python file for full explanation
Attachments
Step 5: Conclusion & Tips
Tip: Instead of having to work on 2 platforms on the receiver side, 1 for arduino and 1 for python you can instead use 'vs-code' (visual studio code) . Import 'Platform.IO' and then python with all the libraries it will take a bit of time and effort but this way everything is well managed as both the arduino and the python are running simultaneously on the same platform so everything is well managed.
Tip: If u are having problems please check the current draw on the power supply to nrf module and add bigger capacitors for extra juice (check online before trying anything out
To further test this i will be putting this module on a UAV to see if it can accurately measure and plot the data in real time .
-_-_-_-_-_-_-_-_-_-_-_-_-_-_-_-_-_-_-_-_-_-_-_-_-_-_-_-_-_-_-_-_-_-_-_-_-_-_-_-_-_-_-_-_-_-_-_-_-_-_-_-_-_-_-