

Introduction: ECG Display With Arduino


This ECG (Electrocardiogram) unit has an integrated display. The display can show individual heart beats in a large format, the train of heart beats in a small format and a Poincaré plot.
It is battery powered and can be worn round your neck on a lanyard.
It is built from an AD8232 module (£7 with leads), an Arduino Nano (£3) and a 2.8" TFT display (£6) plus a few resistors, a pushbutton and so on - the sort of things you already have. For power, you can use 4 AA cells or a single Lithium cell.
You might be interested in your heart during the Covid-19 pandemic. Covid-19 can sometimes give rise to cardiac complications including arrhythmia, ischaemia, infarction, tachycardia and conduction problems. But by the time that happens, you're probably lying in an intensive care ward.
Step 1: Safety and Medical Disclaimer

Here's some legal blurb and a discussion of electrical safety. The most important point is do not operate the circuit when it's plugged into a PC which is plugged into the mains. Oh yes - and don't blame me if you kill yourself.
I am not a medical professional. This Instructable was created for information purposes only. It does not describe a medical device. The information given here is not intended to be a substitute for professional medical advice. If you think you have a medical condition you should contact a qualified health professional. If you think you have a medical emergency you should contact your local emergency services. The device described here is not a substitute for professional medical diagnosis, ECG interpretation or treatment. You are encouraged to confirm any information in this Instructable.
As I have no control over how you build the electronics described here, I cannot guarantee its safety as a medical device. I think it is perfectly safe for me to use but you should make up your own mind. It's running off 4 AA cells or a single Lithium cell for goodness sake - how dangerous can it be?
If you have been fitted with an internal defibrillator or pacemaker, do not attach electrodes to your body and mess about with circuits.
Professional medical electronics should conform to IEC 60601. I have designed medical electronics in the past but it was a few years ago. I seem to have lost my copy of IEC60601 which is annoying as you have to pay for it. Would this device get IEC 60601 approval? How safe is it?
IEC 60601 is a huge document. The most interesting questions to an electronics designer are:
- how much current can I pass through the patient?
- what electrical isolation is required?
- what happens if a "component" fails?
- how much electromagnetic interference can I produce?
- what about a defibrillator?
How much current can I pass through the patient? In "Normal Working" operation the current limit is 100uA a.c. and 10uA d.c. and in single fault condition it is 500uA a.c. and 50uA d.c. This circuit would be classed as an "Applied Part".
I don't know what circuit the manufacturer of the AD8232 module has used. When I examine the one I have, it appears to be one of the circuits in the "Application Circuits" section of the AD8232 datasheet.
The input impedance of the chip pins is 10Gohm so the "Normal Working" operation the current is under 1nA.
The electrodes are connected to the chip through 180k resistors. The chip operates at 3.3V so if the chip goes wrong, the maximum current is 3.3/180k = 18uA.
So the chip and its circuit is safe so long as it's battery operated.
What electrical isolation is required? An "Applied Part" has to be double isolated at 4000VAC. Your desktop PC is not electrically isolated to that degree therefore you should never operate the circuit when it's plugged into a PC which is plugged into the mains. A standard PC power supply almost certainly does not comply with the electrical IEC 60601-1 requirements from several standpoints, e.g. leakage current, dielectric strength.
Can you operate it when it's plugged into a PC which is running on batteries? It wouldn't be allowed for a medical device but for a domestic device it probably would be allowed. (Domestic regulations are less stringent.)
Did I operate it when plugged into a PC which was plugged into the mains? I'm not saying. I've been using desktop PCs for decades and have never got a shock off one. I'm just telling you that you shouldn't do it.
Would the circuit's isolation conform to IEC 60601? If it were battery operated then that's one layer of isolation. Where's the second layer? I guess maybe you'd need two insulated boxes one inside another. IEC 60601 sometimes seems a little silly.
The circuit should have no exposed conductive surfaces that are connected to the electronics. You have to worry about electrostatic discharge: what it the patient rubs a balloon on their hair then touches the box?
The patient shouldn't be able to touch the electronics or the battery or whatever. Yes, I know you've never got a shock off a 6V battery - I'm just telling you the regulations.
Electrical isolation also depends on the creepage distances on the PCB and air clearances. The AD8232 module uses 0603 resistors on its input. An 0603 doesn't have sufficient creepage.
Is the electrode connector suitable? No way. It's a 3.5mm stereo jack plug. You could tape the electrodes to your chest then poke the jack plug into a mains outlet. I don't know why you'd want to but you could - right?
What happens if a "component" fails? IEC 60601 says that the device must remain safe under a 'single fault condition'. A medical device must operate safely not only in normal conditions, but also in abnormal and single fault conditions. The standard does not require that the medical device remains safe with two or more independent faults. A "fault" is typically a component failure.
What counts as a "component"? I have no idea. You could go through each of the electronic components and say "what happens if this goes short-circuit?" and "what happens if this goes open-circuit?". Is the PCB a "component"? How can it fail? Can it suddenly re-arrange itself and connect battery to two electrodes? I can't find a definition of a "component" or "fault".
If it's battery operated and a "component" is an electronic component like a resistor or an IC then the circuit is safe.
How much electromagnetic interference can I produce?EMC is a big problem when designing medical equipment. Hospitals are full of electronic stuff that people's lives depend on so the EMC requirements for medical equipment are a lot tougher than for domestic electronics.
I have no idea how much EMC the board produces. The biggest culprit is probably the Arduino. I've never had an Arduino interfere with a TV or cellphone but I suppose it might.
In theory, you should put the circuit in a Faraday cage and worry about what wires go in and out. In practice, I don't suppose you've ever thought about EMC when you build an Arduino circuit, have you?
What about a defibrillator? So you've built your medical electronics and done the safety analysis and then IEC 60601 has one more surprise for you. Your circuit has to survive a defibrillator.
What is the standard for a defibrillator? I couldn't find one. Each manufacturer decides for themselves and the physician can decide what to apply. Shall we guess a capacitor charged to 300V containing 300 joules? That's connected to your chest somewhere near the ECG electrodes. I suspect that will fry the circuit. IEC 60601 says that the device must remain safe - it doesn't say that it has to continue to work.
A proper medical ECG can survive a defibrillator and go on working. Normally, you would have some protection diodes on the connections to the electrodes. The AD8232 module doesn't have them.
The bottom line is: you could make this circuit into a medical device that would conform to IEC 60601 but it would be a lot of work and testing and certification would be a huge expense. This is just a circuit you're building for fun.
See here and here for discussions of the dangers of a small battery. I have measured the resistance between the electrodes as 150k so, in the worst case, a 6V battery gives a 40uA current - well below the milliamps needed for a battery to be dangerous.
Step 2: AD8232 Module


The AD8232 chip contains a high quality, low noise instrumentation amplifier and signal conditioning to remove noise. It is intended primarily for recording ECG and takes a lot of the hard work out of designing a system.
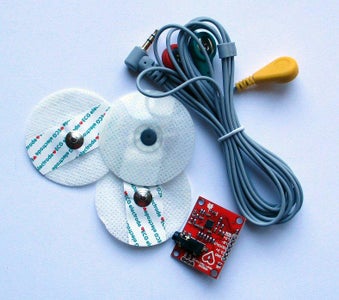
Buy a module like the one in the photo. Search eBay for "AD8232 module" or "ecg module". For convenience, get one with leads and electrode pads.
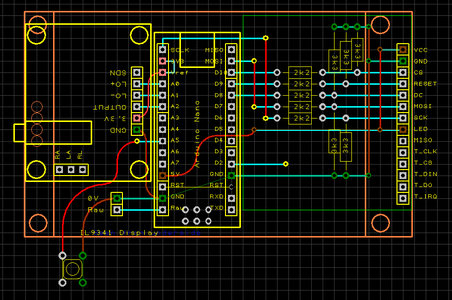
Connect it to an Arduino Nano (or Uno or Mini with a 16MHz 328P) as shown above. I used a solderless breadboard.
The AD8232 includes "leads off detection". If either lead is disconnected, the LO+ or LO- pins of the module go high. For initial testing, I connected the LO+ and LO- pins to two LEDs though 1k resistors to ground. The LEDs light when a lead is disconnected. For the final circuit, remove the LEDs and connect LO+ and LO- to the Arduino. Don't leave the LEDs connected - the AD8232 pins won't go high enough for the Arduino inputs to register HIGH.
Download the ArdECG0.ino sketch and upload it to the Nano. Connect the Nano to a PC running on batteries. In the Arduino IDE, select the Tools|SerialPlotter menu command. Set the baud to 57600.
With the module I bought, the electrode leads are coloured:
- LA Left Arm: Green
- RA Right Arm: Red
- RL Right Leg: Yellow
Yours may be coloured differently. Which lead is which? try touching the leads together:
- Non touching: both LEDs lit
- LA touching RA: both LEDs lit
- LA touching RL: LO+ LED is off
- RA touching RL: RO- LED is off
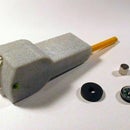
My module came with only 3 sticky electrodes. They'll get used up quickly so I decided to make my own. I happened to have some of the popper connectors left over from another project. I used tinplate for the electrodes themselves. Copper coins work as well but tarnish more quickly and stain your skin. As electrode jelly, I mixed thick shampoo and salt. I stuck them onto my chest with masking tape - it would last a few hours.
Attach the electrodes as shown in the picture above.
- LA to the left side of your chest below the clavicle (collar bone)
- RA to the right side of your chest below the clavicle
- RL somewhere low down away from the heart
The RL electrode is called "Right Leg" but it doesn't actually need to be on your leg. It's a reference electrodethat reduces common-mode interference. Anywhere well below and away from your heart is fine. The lower-left of the abdomen is good. Try to avoid muscles - their movement and electrical activity could interfere with the signal.
Google for "ecg 3 lead electrode placement" for other diagrams.
Attachments

Step 3: Fake Pulse

The ArdECG0.ino sketch can produce a fake "pulse". It's not a very realistic fake but it produces pulses of about the right size at about the right frequency. It's convenient to use it when debugging your unit.
The 100k resistors persuade the AD8232 that there are electrode attached. There are some pads on the AD8232 module PCB labelled RA, LA, RL. I just poked some wires into them.
Step 4: The Heart


Doctors think of the heart as a complex organ but to an electronics designer, it is simply a generator of electrical potentials - several tens of millivolts.
The sinoatrial node (SA node) acts as an oscillator generating a pulse every second or so. Electronically, it's a relaxation oscillator (or Van der Pol oscillator).
The pulse travels slowly to the muscles of the atria and to the atrioventricular node (AV node). The muscles of the atria contract and then relax. As they contract, they pump blood into the ventricles. As they relax, the atria take in blood through the veins from the body or the lungs.
The AV node delays the pulse (by 120-200mS) then sends it to the muscles of the ventricles. Electronically, it too is a relaxation oscillator but its period is much longer than the SA oscillator. It is "prematurely" triggered by the SA oscillator so they become entrained. If the SA oscillator fails, the AV oscillator can oscillate on its own as a backup system.
The muscles of the ventricles contract and then relax. As they contract, they pump blood to the body or the lungs.
The whole process takes around 500mS.
It takes more power to pump blood round the body so the biggest signal we see is from the muscles of the left ventricle.
Sodium, potassium and calcium ions are pumped across the membranes of the cells of the heart muscles. When a heart muscle is relaxed, the difference in ion concentrations causes a 90mV potential difference across the cell membrane. Inside the cell is more negative.
When an action potential occurs a muscle contraction is triggered, Sodium channels open, Na+ ions rush into the cell by diffusion and the voltage goes to zero. That's called "depolarisation". After a 100mS delay, potassium channels open, K+ ions rush out of the cell and re-establish the 90mV resting potential. That's called "repolarisation". Ion pumps then restore the ion concentrations. (Calcium ions are also involved but I'm ignoring them.)
When an action potential occurs in a cell, the cell next to it is triggered. So the action potential spreads through the muscle and also via the Purkinje fibers. It's a slow process; no fast nerve conduction involved.
- Muscle cell conduction is 0.3–0.4 m/s.
- Purkinje fiber conduction is 2–3 m/s.
- Normal neuron conduction is 70-120 m/s.
Purkinje fibers can oscillate by themselves at 20-40 bpm and so act as a backup system if the SA and AV oscillators fail.
An ECG records the action potentials of the different muscles. The action potentials of the muscles are transmitted through the chest wall and skin by simple electrical conduction. So the conduction is fast. By the time it reaches the skin the signal is around 1mV.
Because different action potentials occur in different regions of the heart, by repositioning the ECG electrodes you can record activities in different muscles. With the electrodes at the left and right under the clavicles, you'll get the classical PQRST shape you see in a textbook (called "Lead I"). If you position the electrodes elsewhere you can pick-up other details of heart activity; different positions for pairs of electrodes are called "axes".
It's confusing, when doctors talk about "leads" and "axes". When they say "lead", they don't mean a lead - i.e. an electrode. Remember, what an ECG displays is the difference between two electrodes - it's a differential amplifier. The LL or RL electrode acts as a ground to help with common-mode rejection. A "12 Lead" ECG has 6 electrodes called V1 to V6 which are in a line in front of and to the bottom-left of the heart. Then there are RA and LA near your armpits. There may be two reference electrodes: LL and RL; the extra one doesn't seem to do much so there's usually just one. Pairs of electrodes are also called "leads" - LA-RA is called "Lead I", LL-RA is called "Lead II" and LL-LA is called "Lead III". It's a mess.
The correct placement is:
- V1 is placed on the 4th intercostal space on the Right side of the sternum
- V2 is placed on the 4th intercostal space on the Left side of the sternum
- V4 is placed in the 5th intercostal space in a perpendicular line from the left nipple
- V3 is placed between V2 and V4
- V6 is in the 4th intercostal space in the left mid-axillary line (from the armpit to the hip)
- V5 is placed between V4 and V6
(Right and Left are patient Right and Left. On most males, the 4th intercostal space is between the nipples and is the indentation or soft area between the ribs.)
The maths is:
- Lead I: LA - RA
- Lead II: LL - RA
- Lead III: LL - LA
- Lead aVR: RA - average of (LA,LL)
- Lead aVL: RL - average of (RA,LL)
- Lead aVF: LL - average of (RA,RL)
- Lead V1: V1 - average of (RA,RL,LL)
- Lead V2: V2 - average of (RA,RL,LL)
- Lead V3: V3 - average of (RA,RL,LL)
- Lead V4: V4 - average of (RA,RL,LL)
- Lead V5: V5 - average of (RA,RL,LL)
- Lead V6: V6 - average of (RA,RL,LL)
The different "leads" are like looking towards the centre of the heart from different directions in 3D (see diagram above). The directions are called "axes". To add more confusion the heart also has an "axis" - the electrical activity is symmetrical about that axis. If part of the heart goes wrong, the heart's axis might have "deviation". If "leads" I, II and III look roughly the same, that's normal; if they're different, that's "deviation".
Broadly, what can go wrong with the whole system is that the nodes (oscillators) or the different muscles stop functioning properly. For instance, parts of the muscles might be starved of oxygen and they don't produce an action potential. Or the SA node might run at the wrong rate or the SA and AV nodes might become disconnected and the oscillators run at different rates.
Step 5: Adding a Display


The display is a 2.8" colour TFT LCD screen with a ILI9341 controller, 320x240 pixels. I chose a 320x240 SPI display because can be updated reasonably quickly and uses few Arduino pins.
Search eBay for "320 240 TFT SPI" and you'll find a variety of displays. Get one that looks the same as the photo. A display without a touch screen is cheaper.
I don't use the touch screen function in this project. I want to run the unit on 4 AA cells or a Li-ion cell. As the AA cells discharge their voltage falls. I've found that the Arduino, display and AD8232 work fine with a supply voltage as low as 3V but the touch-screen stops below 4.5V.
The LCD has the following pins:
- VCC 5V
- GND ground
- CS LCD chip select
- RESET reset
- DC data/command
- MOSI SPI bus MOSI of Arduino
- SCK SPI bus SCLK
- LED back light
- MISO SPI data out of LCD (ignored)
- T_CLK SPI bus SCLK (ignored)
- T_CS touch chip select (ignored)
- T_DIN MOSI of Arduino (ignored)
- T_DO SPI data out of touch (ignored)
- T_IRQ touch interrupt request (ignored)
The display I bought has a built-in 3V3 regulator. If you look on the back of the PCB, you'll see it connected to the VCC pin. It's a 662K chip. So the module can be powered by 5V and you can connect it directly to your 5V Arduino pin. The LED power pin can also be connected directly to the 5V pin.
(Check that your display has a 3V3 regulator. If it doesn't and it requires 3.3V power then it takes around 50mA which is just at the limit of what the Arduino Nano's 3.3V regulator can provide. So it may be a mistake to power the display from the Nano's 3.3V pin. You'll should supply your own regulator.)
The logic pins of the display require 3.3V signals. You can't connect them directly to the 5V I/O pins of the Arduino. I've used resistors to drop the voltage.
Adafruit very kindly publish an ILI9341 library and several other libraries are available in Github and elsewhere. I tried a few and didn't like any of them. Some simply didn't work and all were huge. You write an Arduino sketch that draws a line and some text and you find your memory if 75% full. So I wrote my own drivers.
Wire up the display as shown and download the ArdECG1.ino sketch.
I've decided I don't like the way the Arduino IDE uses "libraries". It makes version control difficult. So I now keep the code needed to compile a sketch together. Put all these files in the same folder:
- ArdECG1.ino
- SimpleILI9341.h
- SimpleILI9341.cpp
SimpleILI9341 has a standard set of drawing commands very similar to all such libraries.
Some of the "fast" libraries you can download use special timing loops and are upset when other, maybe slower, devices are used on the same bus. SimpleILI9341 is written in C rather than assembler so isn't quite as fast as it could be but is much more portable and it shares the SPI bus politely with other devices. A Windows program can be downloaded which allows you to make your own fonts and icons.
You can download the ILI9341 data sheet from the web. You send it a command by
set DC low
set CS low
send a command byte
set CS high
and send it data by
set DC high
set CS low
send zero or more data bytes
set CS high
You can see how I do it in the tft_write functions. The data bytes might be a whole row of pixels or a setting for a control register.
The ILI9341Begin() function in the library shows you the initialisation command set I've chosen. You might want to change the commands if you choose a different ILI9341 display (e.g. with more pixels) or want a different orientation. I hope my code is easy for you to see how to change if you need to.
In the circuit diagram are components in a box labelled "Fake Pulse". Do not include them in your final build. They are useful during development and debugging. In the ArdECG1.ino sketch there is a #define to enable/disable fake pulse generation. It's somewhere near the top:
#define bHasFakeECG
Comment out the line to remove the fake pulse.
Step 6: Display Modes

I've used a pushbutton to cycle round the different views of the ECG:
- Large display
- Small display
- Poincaré display
The large display allows you to examine one or two heart beats in detail.
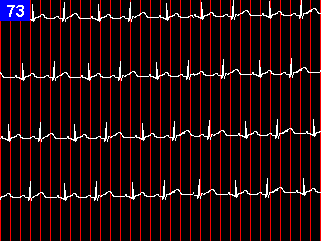
The small display allows you to examine a couple of dozen heart beats to see the regularity of the rhythm.
The Poincaré display shows a history of the rhythm.
The following Steps briefly describe what you might look for in each display. Don't take my word for it. There are lots of pages on the web for teaching student doctors and nurses how to interpret ECGs. They're worth reading.
Step 7: Large Display


The large display mode allows you to examine one or two heart beats in detail. It shows a red background grid to make it look more like a ECG standard chart.
An ECG chart has large and small red squares printed on. The standard scale is
- the x-axis is time with one large square being 200mS
- the y-axis is voltage with one large square being 0.5mV.
Of course, the doctor could have fiddled with the knobs of the ECG machine and changed the gain or the chart speed but pictures in textbooks will show the standard scale.
The display shows the beats per minute in the top left corner. The sketch attempts to recognise "beats" but will be confused by noise or poor electrode connections.
The sketch tries to keep a peak in the left third of the screen so it isn't jumping around too much and is easier to study. It can only do so it the heart beat is regular but a healthy heart doesn't beat regularly so that feature doesn't work too well.
You should be able to see the classic ECG trace you get in a textbook.
The first bump is P wave. That's the atrial depolarisation - the muscles of the atria starting to contract. There's a pause - the "PR segment" - while blood flows into the ventricles.
The big spike is the QRS complex. That's the ventricular depolarisation - the muscles of the ventricles starting to contract. There's another pause while blood flows out of the ventricles.
The next bump is the T wave. That's ventricular repolarisation as the muscles of the ventricles relax. There's another pause and it all happens again.
There ought to be a bump for atrial repolarisation but it's hidden under the QRS complex. There can be a U depolarisation wave but it's often too small to be seen.
It takes years to train a cardiologist but you should be able to see broadly what's going on. Here, here and here are some web pages. Or search for "ECG interpretation".
The P wave can tell you about what's going on in the atria. For instance the shape of the P wave can tell you whether the left and right atria are acting together. If the P waves and the QRS waves are not synchronised then the two oscillators have become disconnected.
The QRS and ST segments show what's going on in the ventricles. An elevated ST segment can indicate a myocardial infarction ("heart attack"). A depressed ST segment can indicate a myocardial ischaemia ("angina"). Both are due to parts of the ventricle muscles not functioning properly. Ischaemia is when a region of the muscles is struggling due to lack of oxygen; infarction is when a region is in really in a bad way and has given up. But don't panic if you seem to have an elevated ST - it can also be due to the electrodes not being positioned properly.
Step 8: Small Display
The small display mode allows you to see the overall heart rate and look for irregularities. A "normal" heart rate depends on age
- 3-5 years: 80-120 bpm
- 6-10 years: 70-110 bpm
- 11-14 years: 60-105 bpm
- 15+ years: 60-100 bpm
The average woman's heart rate is 4bpm higher than a man's. Both male and female average heart rate drops by 4bpm as you get old.
"Bradycardia" is a heart rate below the normal range: less than 60bpm in adults. "Tachycardia" is a heart rate above the normal range: more than 100bpm in adults.
Clearly, the heart rate averaged over the last minute will depend on how hard you are exercising or how excited you are. The time between heart beats (the R-R interval) can also vary from beat to beat. One beat might be, for instance, 10% shorter than the next. That variability from beat to beat is called HRV (heart rate variability).
Higher HRV is considered to be a "good thing". Supposedly, the more variable the heart beat is, the better the heart is able to respond to different requirements. HRV decreases as heart rate increases (as you'll see in the next display). HRV also decreases with age, with infarction, with diabetes and all sorts of other conditions
"Ectopic" beats are an interval that is too short or too long. A major cause is something wrong with the conduction system. Premature atrial, junctional and ventricular contractions can occur. I cannot find a definition of when a short or long interval is classed as ectopic rather than due to normal HRV but automatic systems often decide that any interval more that 20%-30% different from the preceding one are "ectopic". Ectopic beats sometimes have a different shape from normal ones.
Ectopic beats could be indications of something wrong. They could be due to damage from a heart attack, cardiomyopathy, valve malfunction, etc. Or they could be harmless perhaps caused by alcohol, caffeine, prescription drugs, stress, etc.
Step 9: Poincaré Display

The Poincaré display mode plots the length of one interval (from R to R) on the x-axis against the length of the next interval on the y-axis.
500 points are stored in a circular buffer. When the buffer is full, old points are overdrawn in black.
The axes are labelled in BPM.
Some researchers think that HRV, ectopic beats and other irregularities in heart rate are best detected by a Poincaré display. Although ECG Poincaré plots been around since 1990, they are not "mainstream" and many workers prefer a simple chart.
If you google for "ecg poincare" you will find a lot of research papers.
Here is a good discussion of what can be seen in a Poincaré plot.
A normal Poincaré plot shows a diagonal band of points tapering to the bottom left. This demonstrates that . HRV decreases as heart rate increases. An overall fatter band indicates greater HRV.
Tachycardia shows as a small group of dots near the lower left. Bradycardia shows as a scattered group towards the top right. Arrhythmia shows up as groups of dots away from the main diagonal. Fibrillation shows as a large cloud at the bottom left. A column of dots at the top left may be premature ventricular contractions. Pauses in beats show as clouds in the top-middle and right middle.
Step 10: Filtering

I found that the circuit had little noise so long as it was running on its own battery and the electrodes were making good contact. But there is some noise and I thought I'd try removing it with a digital filter.
You can read about digital filtering on an Arduino in my Speech Recognition project. I won't repeat it all here. As the sample rate is very low - every 5mS - the Arduino has plenty of time to do the maths.
There is a good discussion of digital filtering here and an online calculator for the coefficients here. The calculator gives the coefficients as real numbers; multiply them by 65536 before plugging them into my code.
Of course, you don't want the filter to mess up the shape of the "signal" - just to remove the "noise". It's important to look at the display with and without filtering and convince yourself you like the results. In particular, the Q and S parts of the wave have frequency components close to the "noise" frequencies you are trying to remove. You don't want the filter to alter them.
I tried a low-pass filter (40Hz Q=1) and it made some difference. The noise gets worse if you hold your hand near a mains device like a desk lamp. So I tried a 50Hz notch filter (Q=1 OR Q=2) - that removed a lot of noise. I liked the result and stuck with that. It seems that most of the noise is mains hum.
(In your country, mains hum might be at 60Hz. I've included a 60Hz notch filter as well.)
I have a philosophical distrust of filters. I think words like "signal" and "noise" can be a delusion. The "truth" is what you get from the ADC. Anything you do to the data after that is just you making the data prettier so it pleases you more.
I also wondered if a high-pass filter could remove the big fluctuations due to muscle movement. I added a high-pass filter with a cut-off frequency of 2Hz (Q=1). It may have fixed the big fluctuations but it also really messed up the P and T waves. I took it out.
You'll see calls to the different filter functions in the main loop() function. Comment them out (or in) as you see fit.
Step 11: Building It
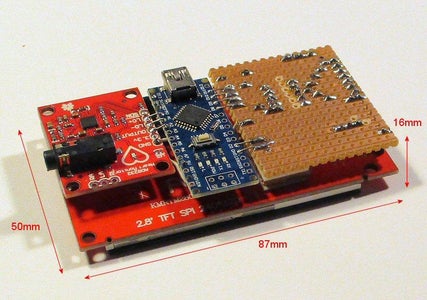


I put the voltage convertor resistors on a piece of stripboard and soldered it to the pins of the display. The AD8232 module is stuck onto the back of the display with sticky pads and a 2.5mm spacer. The Nano is suspended in between the two boards by soldered wire links. The whole assembly is quite compact and solid.
I thought about 3D printing a case but went for old-school methods. I glued 0.7mm polystyrene sheet together to make a box. The strap is old elastic that had lost its elasticity.
Shielding makes some difference to the noise level so I lined the back of the box with kitchen foil. A "brush" made from stripped cable connects it to ground
Step 12: Power Supply


Now it needs a battery. The total current consumption is around 127mA and I'd like it to run for 8 hours so that's 1000mAh.
Surprisingly, the Arduino, the AD8232 module and the display all run fine with 3.7V on the "5V" pin. By the time it gets down to 3V, the display if getting dim but everything still works.
My first thought was to run it 4 AA cells. An AA cell has a capacity of over 1000mAh. The initial voltage of 4 typical AA cells is more than 6V but it drops to 4.8V as it discharges. The Arduino cannot withstand 6V on its "5V" pin so we must connect the 4 AA battery pack to the Arduino's Vin pin. The Arduino has a regulator with a dropout of around 0.7V so the voltage of the Arduino's "5V" pin will be above 4V for most of the battery life.
AA cells are a good choice. They have the advantage that "recharging" takes a minute. The only problem is their huge size. A nice slim unit would have a big fat battery pack on the back.
When a local electronics shop closed I bought a big bag of Li-ion battery packs at a good price. It included several NP-BG1 packs (for Sony Cyber-shot). An NP-BG1 contains a 1000mAh Li-ion cell (capacity depends on manufacturer).
What if we connect a 3.7V Li-ion cell to the "5V" pin of the Arduino? It all works fine. That simplifies the power supply. So I added a Li-ion cell and a 3.4mm barrel jack to charge it.
(The NP-BG1 contains a thermistor to check for overheating so a 3-pin connector would have been better. But the thermistor is the wrong value for the charger I'm using and I did without.)
The On/Off switch connects the cell to either the Arduino or the charger so it's impossible to charge the unit when it's in use.
Step 13: Future

How can this project be expanded?
It would be nice to save a whole day's worth of data. With a sample period of 5mS, that's 17Mbytes of data. At first sight, an SD card would be ideal but the write time of an SD card is very variable. Sometimes it takes a couple of mS but sometimes it erases a large number of blocks of flash memory and takes couple of hundred mS. An SD card can cope with the average data rate so I'd probably have a second Arduino that buffered the data stream from the ECG Arduino and wrote it occasionally in large blocks - I wouldn't trust multi-tasking on a single Arduino but it might work. Serial EEPROMS are available that can write fast enough but only hold a few Mbits. A large flash memory chip may be the way to go - you may be able to erase it all (a slow operation) at the start of the day then write individual bytes in a few mS. But an SD card has the advantage that you can take it out and plug it into a PC.
There are a ridiculous number of ECG file formats. The HL7 aECG standard might be the one to go for.
If you stored a whole day's data then the Poincaré plot becomes really useful. Click on a point and that beat is displayed so you can quickly find weird beats.
Pulse arrival time (PAT) or pulse transit time (PTT) is the time interval between a R wave in the ECG and the measurement of the pulse on (e.g.) your finger with a pulseoximeter. Pulseoximeters are very easy to build. It seems that pulse arrival time is related to blood pressure. It needs calibrating for each individual but then it's a simple non-invasive way of measuring blood pressure over a whole day. It can also be used to estimate arterial stiffness. There is a linear relationship between pulse transit velocity and systolic blood pressure.
Can the ECG act as an electro-oculograph? I taped the ECG electrodes just to the outside of my left and right eye sockets. It worked. I could easily measure a 0.7mV "square wave" as I moved my eyes to the left or right. The problem is that the ECG module I'm using has built-in filters. The high-pass filter removes signals below about 5Hz so it a slow square wave looks like this.
Maybe using the AD8232 chip without the rest of the module would mean a different filter could be used but the AD8232 has lots of other built-in signal processing. I think it would be worth trying if you're interested in electrooculography.
Taping the electrodes above and below the eye didn't work at all well. I could hardly see an effect. But a blink was easily visible.
I also tried to get electromyograms using the ECG machine. It didn't work. I think myograms should be regarded as fast AC signals. Electromyogram circuits generally include a rectifier and smoother so the overall AC "energy" of the signal is measured. The filtering in the AD8232 module removes all those high frequencies and myograms don't show up at all.


