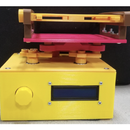
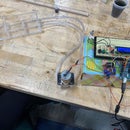
Introduction: Low Cost, Low Speed Wind Sensor
We built a low cost, low speed wind sensor device to obtain accurate wind speed data when running tests from 1-5 m/s. Until now, the only way to measure low wind speeds was either by using expensive equipment like a hot wire, or an inaccurate pitot tube. Using the science of fluid dynamics combined with mechanical vibrations we developed a low cost, low speed wind sensor that uses the vortex shedding of a vibrating cylinder to calculate wind speed. This instruction document is intended for people or groups that have a wind tunnel system and wish to use a low budget solution for their low wind speed tests. If you would like to read more about our findings, our final project report is attached.
Supplies
Bill of Materials
- Strain Gauge (350Ω)
- Vibration Damping Sandwich Mount with Studs
- 1.5 mm OD Hollow Rod
- NI DAQ USB
- NI DAQ USB MATLAB Code (attached in Step 11)
- 1/4" Acrylic
- Thorlabs 1/2" OD Post Holder
- ThorLabs 2" OD Metric Manual Rotation Stage
- ThorLabs Breadboard with 8-32 taps
- 3/8" Polypropylene Sheet
- Wind Tunnel with Computer Setup (example)
- 1/2" OD x 7" Aluminum Rod
- 2 X 8-32 1" Screws
- 4 X M6 1/2" Screws
- 6 X 8-32 Hex Nuts
- 1 X 5-40 1/2" Screw
Tools
- Laser Cutter
- Mill
- Wire Cutters
- Band Saw
- MATLAB Software
- Computer
- 0.4", 1/4" End Mill Bits
- 0.15", 1/8", 1/4" Drill Bits
- 5-40, M6 Taps
Step 1: Making the Acrylic Mount
Using the attached Illustrator file, laser cut the acrylic mount.
Attachments
Step 2: Machine Strain Gauge Mount
Using a 1/2" diameter by 7" length rod of aluminum mount, machine the strain gauge mount. To create the dog bone shape, use an end mill with a .4" bit to remove material from the center (refer to the CAD model and drawing attached for exact dimensions). Then, using a drill press with a .15" drill bit aligned at the center of the top face, remove .5" of material from the rod. Next, on the outer surface, 1/4" down from the top face, use a 1/8" drill bit to drill to the center bore. Finally, use a 5-40 tap to add threads to this cut. Attached is a CAD model and drawing of the finished part.
Attachments
Step 3: Attach Strain Gauges
Apply strain gauge to both sides of the dog-bone shape aluminum bar to form a bending load cell, so that we can read bending loading from the deformation of the bar with a Wheatstone bridge circuit. Attaching the strain gauge can be the most tricky part of the setup, it takes a little experience. A short tutorial is shared here to help you attach the strain gauge quickly and neatly.
Step 4: Machine Stage Mount
In order to machine the Stage Mount, you will need approximately 3"x 4" of 3/8" thick polypropylene, a band saw, drill press, an end mill, and a 1/4" drill bits. Using the band saw and the dimensions provided in the drawing, cut the PVC's octagonal outline. Next, using the end mill with a 1/4" bit, machine the 2 symmetrical slots. Lastly, use the drill press to cut four alignment holes into the mount and tap these holes with an M6 thread size. A CAD model and CAD drawing are attached to show to end product and specific dimensions.
Attachments
Step 5: Assemble Vibration Isolation System, 1
(This step assumes that your breadboard is already rigidly mounted approximately 6 inches below the wind tunnel.) Screw the sandwich mounts onto the bread board spaced out in a 4 x 4 square.
Step 6: Assemble Vibration Isolation System, 2
Next, place the hollow steel rod into the strain gauge mount and tighten the set screw.
Step 7: Assemble Vibration Isolation System, 3
Place the strain gauge mount in the post holder and tighten the set screw.
Step 8: Assemble Vibration Isolation System, 4
Use 1/2" length M6 bolts to attach the rotation stage to the stage mount.
Step 9: Assemble Vibration Isolation System, 5
Attach the top unit with the acrylic stage by inserting 2, 1" long 8-32 bolts through the aligned slots.
Step 10: Assemble Vibration Isolation System, 6
Now, place the whole unit on top of the dampers and use 4 hex nuts to rigidly connect the system.
Step 11: Setup Electronics and Software
The prototype of the low-speed wind sensor is present in the Brown Design Workshop student wind tunnel. The cylindrical wind speed probe is sitting on the sting load cell in the wind tunnel. When there is the wind, the vortex shedding will generate vibration on the probe. A single dimension load cell is placed beneath the probe, which can read the bending torque from the vibration on t.he probe. The fluctuating signal will be first picked up and amplified by the half-bridge circuit. It will be better if there is a power amplifier like FUTEK CSG110 to amplify the signal for the second time. A USB DAq Card is used to transfer the analog signal into a digital signal so that it can be read and analyzed by the workstation. An oscilloscope is also used to monitor the analog signal output.
Attachments
Step 12: Validate the Functionality
A simple “swing test” is used to validate the functionality of the system. A 5g weight is tied on the end of a 10cm string and hanging about the end of a horizontally placed load cell. The amplitude of the force fluctuation should be just about the value of our vortex shedding estimation. The oscilloscope should be able to show the different signal levels when the weight is swinging and the DAq should be able to show the natural frequency of the simple pendulum system.
Step 13: Collect Measurements
Set the desired initial motor frequency of the wind tunnel. Our range was from 0 Hz to 24 Hz. You should see the hollow rod vibrating as a result of the vortex shedding. A video example is attached.
Next, run the Matlab code to drive the data acquisition. Follow the prompts in the code to input the motor frequency and the Pitot tube reading (if your wind tunnel has one). The data acquisition will be complete when a power-frequency graph appears (see the example graph). Make sure to save this figure (click File on upper left of figure, then save) and the workspace variables (click the Save Workspace button on the Home tab) for post-processing.
Then, set the motor frequency to the next desired value and repeat the process until data has been collected for the entire range of desired motor frequencies.
*As a check, you can compare the power-frequency graphs collected at the same motor frequencies both with and without the vibration isolation mount. You should see fewer peaks with the vibration isolation mount if the set-up is working correctly.
Step 14: Analyze the Data
After the data is collected, the frequency peaks can be used to calculate the wind speed. There should be a maximum peak in the power-frequency graph for each motor frequency, and the peak should move to a higher frequency as the motor frequency increases (as seen in the red circled peaks on the image attached). Using either the Strouhal number or the Roshko relationship, depending on the Reynolds number of the flow, and the peak frequency, the wind speed can be calculated (see the linked technical report for more details on this calculation, especially equations 1 and 2).
In summary, you can first calculate the wind speed assuming the Strouhal number is equal to 0.2. To find the wind speed, multiply the frequency of the peak by the diameter of your cylinder, and divide this by 0.2. With this speed just calculated, check the Reynolds number of the flow, or the density of the wind multiplied by the speed multiplied by the diameter of the cylinder, and divided by the viscosity of the wind. If the Reynolds number if greater than 200, the calculated wind speed is good. Otherwise, do the same process, but use the Roshko relationship to find the wind speed.


