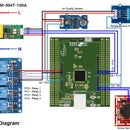
Introduction: Smart Energy Monitoring & Control System (Edison Inside)
Power management has been one of the most hot topics in the past decade because of the decrease in the energy reserves. Power shutdown is a major problem now-a-days and it occurs because a lot of power is wasted in industries. Reducing energy use and waste is necessary as well as good for the environment. Measuring and monitoring your home’s energy consumption is the first step toward finding ways to decrease it.
While almost every residence has an electric meter, it usually only shows total household energy (kWh) consumed, although some include instantaneous power being used (kW). And the meter is usually placed where it is convenient for the utility—not for you—to read. But conservation-minded homeowners and renters can choose from several products that measure and record electricity consumption to reveal the energy hogs.
If you want to use energy data to help reduce usage or convince other household members to adopt energy-saving behaviors, my smart power & energy monitoring system is for you. My project deals with this problem in a simple and effective way by auditing power & the energy usage and can be used in home and industries.
My system will monitor:
- Voltage,
- Current
Calculate & Display
- Active power,
- Reactive power,
- Apparent power,
- Power factor and
- Total energy consumption
Send all the data to cloud and graphically show those by different charts & graphs.
I connected a LCD display to Edison for showing the data. The system also sends real time data to cloud server and you can monitor your data from anywhere of the world. Intel Edison is the center of the system. Current sensor & AC/AC adapter is used for sensing current and voltage.
Step 1: Some Basics of Elecrical Power & Energy
From both voltage, current and power graphs above (figure 1, 2) at mains frequency the power draw fluctuates 50/60 times a second, for us humans we cant keep up with change at this speed and so we have a more useful value for power: the average of the instantaneous power which we call real power! (or active power).
Real power is often defined as the power used by a device to produce useful work. Looking at the graph above the positive bits are power going to the load from the supply and the negative bits are power going back from the load to the supply, the power that was actually used by the load the power going to minus the power going back is the real power.
Reactive power (or imaginary power) is a measure of the power going back and forth between the load and the supply that does no useful work.
Another useful measure of power is Apparent Power which is the product of the Root-Mean-Squared (RMS) average of the Voltage and the RMS average of the Current. For purely resistive loads real power is equal to apparent power. But for all other loads real power is less than apparent power. Apparent power is a measure of the real and reactive power but it is not a algebraic sum of the two, as the sum of the two does not take into account phase differences.
Relationship between real, reactive and apparent power for IDEAL sinusoidal loads:
- Real Power = Apparent Power x cosΦ
- Reactive Power = Apparent Power x sinΦ
cosΦ is also known as power factor.
In AC circuits, the power factor is the ratio of the real power that is used to do work and the apparent power that is supplied to the circuit. The power factor can get values in the range from 0 to 1. When all the power is reactive power with no real power (usually inductive load) - the power factor is 0.
We can calculate power factor from the following equation:
- Power Factor = Real Power / Apparent Power
but the relationship
- (Apparent Power)2 = (Real Power)2 + (Reactive Power)2
which is true for pure sine waves is no longer correct, neither is power factor = cosΦ, since the effects of higher order harmonics in both voltage and current waves must be considered.
For more about AC system and power:
1. http://www.allaboutcircuits.com/textbook/alternat...
Step 2: Calculation of Power & Energy
AC Voltage and current continually alternate, as the name suggests, if we draw a picture of the voltage and current waveform over time, it will look something like the image above (depending on what's using power - the current waveform - blue in the diagram below - is what you get if you look at a typical laptop power supply. There's an incandescent light bulb in there as well).
The image was made by sampling the mains voltage and current at high frequency, which is exactly what I do on my project. I will sample instantaneous voltage and current (50 sample per 20ms). Though higher sampling rate increase the accuracy - we're limited by the Edison Arduino analog read command and calculation speed).
Calculating real power
Real power is the average of instantaneous power. The calculation is relatively straightforward on the Edison & Arduino. First we calculate the instantaneous power by multiplying the instantaneous voltage measurement with the instantaneous current measurement. We sum this instantaneous power measurement over a given number of samples and divide by that number of samples:
for (n=0; n<number_of_sample; n++){
  // inst_voltage and inst_current calculation from raw ADC goes here
  inst_power = inst_voltage * inst_current;
  sum_inst_power += inst_power;
}
real_power = sum_inst_power / number_of_samples;
Root-Mean-Square (RMS) Voltage
The root-mean-square is calculated in the way the name suggests first we square the quantity, then we calculate the mean and finally the square-root of the mean-square, this is how its done on the Arduino:
for (n=0; n<number_of_sample; n++){
   // inst_voltage calculation from raw ADC input goes here.
    squared_voltage = inst_voltage * inst_voltage;
    sum_squared_voltage += squared_voltage;
 }
 mean_square_voltage = sum_squared_voltage / number_of_samples;
 root_mean_square_voltage = sqrt(mean_square_voltage);
Root-Mean-Square (RMS) Current
Same as the RMS voltage calculation:
for (n=0; n<number_of_sample; n++) {
    // inst_current calculation from raw ADC input goes here.
    squared_current = inst_current * inst_current;
    sum_squared_current += squared_current;
 }
mean_square_current = sum_squared_current / number_of_samples;
root_mean_square_current = sqrt(mean_square_current);
Apparent power
apparent_power = root_mean_square_voltage * root_mean_square_current;
As RMS voltage is generally a fixed value such as: 220V (+10% -6% in the BD) its possible to approximate apparent power without having to make a voltage measurement by setting the RMS voltage to 230V. This is a common practice used by domestic energy monitors.
Power factor
power_factor = real_power / apparent_power;
That's the fundamentals of AC power measurement on an Arduino.
Step 3: Device & Component Used
- 1x Intel Edison
- 1x Arduino Compatible Edison Breakout
- 1x Hall effect current sensor
- 1x AC/AC adapter (220/12)
- 1x LCD display (4*20)
- Resistor
- Capacitor
- Breadboard
Step 4: Prepare Your Edison for the Project
I am not going to cover the initial setup of Intel Edison board. Many tutorials are available in the Internet about the setup. You can follow the following instructable which well cover how to get started with Edison and meet most of the requirement for our project.
An Absolute Beginners Guide To The Intel Edison
Another good instructable:
REAL beginner's guide to setting up the Intel Edison (with Mac OS)
Or you can follow the tutorial from Intel or Sparkfun (Edison Getting Started Guide).
Before proceeding further be sure you have:
- Connected The Edison to the Breakout Board
Installed The Required Drivers (FTDI Drivers, Edison Drivers)
Downloaded The Intel Arduino IDE and tested with Blink example
Flashed Your Edison with Yocto Linux Image
Set Up WiFi
Upgrade The Edison Image
Ready to connect Edison with SSH
Step 5: Cloud Services (IoT Analytics Account Creation & Login)
Intel operates an excellent cloud service called IoT Analytics for users of the Developer Kit. Intel Galileo and Edison device developers can collect, store, and analyze data without having to invest in large-scale storage and processing capacity. While it is possible to store sensor values directly on an Intel® Edison board, IoT Analytics is the preferred, convenient location for storing sensor values for safekeeping and future manipulation.
For connecting devices to the cloud you need to create an account by going the the IoT Analytics Dashboard site here. You will be directed to the Sign In screen. Click "Sign Up Here" to create a new account. You have the option of using your Facebook, Google+, or GitHub accounts to register, or you can create a local account with an email address and password. If you click "Sign Up Here", the Create User screen appears. You must provide a valid email address and password. Review the Terms and Conditions, click the check box "I agree to the Terms and Conditions of Use", and hit "Create". Go to your email to confirm your account. You are prompted to create an account name the first time you sign into the Dashboard. Once you have authenticated, the My Dashboard page appears. My Dashboard provides access to all the information you need to manage your devices. The main screen displays the number of devices in communication with the IoT cloud, messages communicated between IoT devices and the cloud in the past hour, and the percent of "healthy" devices. Notice that there are no devices registered yet.
Let, register our device to IoT Analytics Dashboard.
The Edison links to the cloud via the IoT Gateway Agent, which abstracts away the complexities of cloud connectivity. It implements the necessary message formatting and security during data transmission. If you are updated with latest Yocto image, Edison is pre-installed with the necessary software. Check to see if your device is pre-installed with the Agent . In a serial communication session with your IoT device, enter the following command:
iotkit-admin
If you see a message that begins with, “Usage: iotkit-admin …”, as shown below, the agent is already installed.

To test network connectivity, enter the following command:
iotkit-admin test
Address any connection problems and repeat the test command as necessary to ensure that your device can connect to the IoT Analytics site. You should see the following message:
2014-11-10T21:50:54.062Z - info: Trying to connect to host ...
2014-11-10T21:50:54.570Z - info: Connected to dashboard.us.enableiot.com
2014-11-10T21:50:54.571Z - info: Environment: prod
2014-11-10T21:50:54.571Z - info: Build: 0.10.
More details: Intel® IoT Platforms: Getting Started: Cloud Analytics
OK, our Edison is ready to communicate with IoT Analytics cloud. Now, we need to add our device to IoT Analytics Dashboard. Follow the next step.
Step 6: Adding Device to IoT Analytics Dashboard
Before connecting Edison to the cloud, but it needs to be registered on Intel's Analytics Dashboard. Registering the device opens a channel of communication between it and your cloud account. Follow the steps to register your device.
1. After log in to the IoT Analytics site, click the menu icon in the top left. Select Account.(Figure 1)

2. On the Details tab, locate the activation code, which is displayed in the Activation Code field. To you see some dot then click the eye icon to display the code. (Figure 2)

3. If code is expired, click the refresh icon. code will be displayed. The activation code is valid for 60 minutes. If the code expires before you have activated your device, click the refresh icon to generate another code again. (Figure 3)

4. Note the Activation Code (Figure 4)

4. In the serial communication window, enter the following command:
iotkit-admin activate ACTIVATION_CODE
Paste the activation code where ACTIVATION_CODE is written.Your device is associated with the account that the activation code was generated and you will get following message.

Now, you can verify this on your IoT Dashboard in the Devices box.

Our device is now registered. Once the device is registered, sensor data from that device is sent to the IoT dashboard. However, to obtain data from a sensor you must first create a catalog item for it. The IoT Dashboard calls catalog items "components", and there is a component for each sensor (or may be for each data item) connected to your IoT device. This enables your Dashboard to grab real-time data from your device. Our next step is to create component.
Creating Component
1. Access the Component Catalog by clicking on Catalog tab on the Account page. Your account comes with three default components: humidity, power, and temperature. A component can be either a sensor or an actuator. To add a new component, click Add a New Catalog Item at the bottom of the screen.

2. A Component Definition box appears. Add and save relevant information about your sensor in the Definition Box shown in the following figure. This current component will receive current from the current sensor.

2. Following the same procedure create four more component named as voltage, realpower, reactivepower, powerfactor and energy as we want to sent all the parameter to the cloud from Edison.
Registering Component into Edison
After creating a component in the Dashboard, you need to register it on your device. To register your component enter the following command:
iotkit-admin register component_name component_id
Component name and type can be found in terminal by the following command
iotkit-admin catalog
After typing the command view of terminal window.

From the figure it is clear that our first component is current an id is current.v1.0
For registering current component type:
iotkit-admin register current current.v1.0
You may need to restart the agent before you can register a component. Enter the following commands to restart the agent:
systemctl stop iotkit-agent<br>systemctl start iotkit-agent
After successful registration you should see following message.

Congratulation! your registration is complete.
Step 7: Makeing the Circuit
For the power and energy calculation we need two parameter. Supply voltage and load current. Our utility supply is 220V AC and enough for an electric shock. The measurement can be made safely (requiring no high voltage work) by using an AC to AC power adaptor or transformer. The transformer provides isolation between the high and low AC voltage.
Voltage Sensor (AC/AC transformer)
AC to AC power adapters or transformer can come in many different voltage ratings. The first thing that is important to know is the voltage rating of your adapter. I have used a 220V to 12V transformer for voltage measuring.

The output signal from the transformer is a near-sinusoidal waveform. If you have a 12V (RMS) power adapter the positive signal peak should occur at +16.97V and the negative signal peak should occur at -16.97V. However due to the poor voltage regulation with this type of adapter when the adapter is un-loaded (as in this case) the output is often around 14V-16V (RMS) giving a peak voltage of around 19V-23V. The voltage output of the transformer is proportional to the AC input voltage.
The signal conditioning electronics (Arduino, Edison) needs to convert the output of the adapter to a waveform that has a positive peak that's less than 5V and a negative peak that is more than 0V and so we need to
- 1) scale down the waveform and
- 2) add an offset so that there is no negative component.
The waveform can be scaled down using a voltage divider connected across the adapters terminals and the offset (bias) can be added using a voltage source created by another voltage divider connected across the Arduino's supply shown in following figure.

Resistors R2 and R1 form the voltage divider that scales down the power adapter AC voltage and resistors R3 and R4 provide the voltage bias. Capacitor C1 provides a low impedance path to ground for the a.c. signal. R1 and R2 need to be chosen to give a peak-voltage-output of around 1V, for an AC-AC adapter with an AC 9V RMS output a resistor combination of 10k for R1 and 100k for R2 would give a suitable output:
peak-voltage-output = R1/(R1 + R2) x peak-voltage-input = 10k /(10k + 100k) x 12.7V = 1.15V
The voltage bias provided by R3 and R4 should be half of the Arduino supply voltage and so R3 and R4 need to be equal. Higher resistance lowers energy consumption. I used 100k resistors for both R3 and R4.
As the Edison is running at 5V the resultant waveform of the circuit has a positive peak of 2.5V + 1.15V = 3.65V and negative peak of 1.35V satisfying the Edison analog input voltage requirements and leaving plenty of room so that there is no risk of over or under voltage.
If you would like detailed information on how to calculate the optimum values for the components taking component tolerances into account, then this page might help you.
Current Sensor
There are various methods available for sensing current flow in a system. Usage of shunt resistors, current transformers and usage of Hall-effects sensors are some such available methods. In this instructable I used Allegro ACS712 sensor measuring current. Allegro ACS712 sensor operates according to the Hall-effect principal and it can be used for both AC and DC current measurement. There is no need of auxiliary circuits for this sensor it is an immense advantage over the other available methods.

This is a bi-directional measuring device and therefore this can be used for both AC and DC current sensing. The ACS712 sensor is designed for three current ranges 5A, 20A and 30A. The sensor consists of an integrated circuit which works according to the Hall-effect principal. This IC generates a voltage proportional to the current flowing in the circuit. Breakout board of current sensors based on this device also available in the market and they make your life easier.
Interfacing with Edison Arduino Breakout
Following figure shows the connection of the ACS712 sensor to the Edison Arduino Base.

Complete circuit diagram, breadboard connection, fritzing project files and sensor datasheet are attached. Connect all the component accordingly.
LCD Connection
Connect LCD to Edison according to circuit diagram. The connection diagram is given bellow.Connect a 330ohm resistor to the LED+ pin of LCD. Vo pin of LCD should connect to a variable resistor if you want to control the contrast of LCD or may connect to ground for maximum contrast.

Next
Step 8: Arduino IDE for Edison
For programming Edison with Arduino IDE first you have to download Arduino IDE from here. Download the installer and install it.
1. Run the IDE and go to the Boards Manager from Tools menu.

2. Select Intel i686 Boards and click to Install

3. Installation will be started. It will take some time to download and install. It is the time to take a cup of Coffee.

3. Necessary package is installed for your Edison board.

4. Congratulation, your Arduino IDE is now ready to compile your program for your Edison Board.

Step 9: IoT Kit Arduino Library for Cloud
Intel has provided Arduino library and example code to help you transfer data from their hardware to the Analytics Dashboard. Their arduino library "IoTkit.h" depends on the library "ajson.h" to send a receive data. aJson is a library to receive, understand, create or modify JSON strings directly in the Arduino environment.
To install the IoTkit library:
- Go to the Github page for IoT Kit here and download the zip file to your computer.
From the Arduino IDE, select Sketch -> Include Library -> Add .ZIP Library...
Select the IoT zip file recently downloaded. It should be called iokit-samples-master. Double click to open.
Select Arduino -> IoTkit.zip
Restart the Edison IDE to invoke the change. You should see IoTKit under File -> Examples.
To install the aJson library:
- Go to the Github page for aJson here and download the zip file to your computer.
- Download and install like IoTkit
Step 10: Program Your Edison
Our environment is almost ready to program Edison board. The complete program is attached. Upload it to your Edison using arduino IDE. You can modify the program as your requirement. Explanation of complex statements are given as comment.
#include <IoTkit.h>    // include IoTkit.h to use the Intel IoT Kit
#include <Ethernet.h>  // must be included to use IoTkit
#include <aJSON.h>
#include <LiquidCrystal.h>

// create an object of the IoTkit class
IoTkit iotkit;

const int vSensorPin = A0;
const int cSensorPin = A1;

const int numberOfSamples = 3000;

int sampleV, sampleC;
float voltageV, voltageC;
float instVoltage, instCurrent;

float sumI, sumV, sumP;

float realPower, apparentPower,reactivePower;
float powerFactor, voltageRMS, currentRMS;
unsigned long last_kWhTime, kWhTime;
float kiloWattHour = 0.0;

// RS, EN, D4, D5, D6, D7
LiquidCrystal lcd(7, 6, 2, 3, 4, 5);

void setup() {
  // put your setup code here, to run once:
 pinMode(7, OUTPUT); // not needed for arduino
 pinMode(6, OUTPUT); // but must set as output for Edison LCD library
 pinMode(5, OUTPUT);
 pinMode(4, OUTPUT);
 pinMode(3, OUTPUT);
 pinMode(2, OUTPUT);
 iotkit.begin();
 lcd.begin(20, 4);
 lcd.setCursor(0, 1);
}

void loop() {
  // put your main code here, to run repeatedly:
  calculatePower();
  displayPower();
  sendToCloud();
  delay(2000);
}

void calculatePower(){
    for(int i=0; i<numberOfSamples; i++){

      sampleV = analogRead(vSensorPin);
      sampleC = analogRead(cSensorPin);

      voltageC = sampleC*5.0/1023.0;
      voltageV = sampleV*5.0/1023.0;

      instCurrent = (voltageC-2.5)/0.66;
      instVoltage = (voltageV-2.46)*7.8;

      sumV += instVoltage * instVoltage;
      sumI += instCurrent * instCurrent;

      sumP += abs(instVoltage * instCurrent);
      }

      voltageRMS = sqrt(sumV / numberOfSamples);
      currentRMS = sqrt(sumI / numberOfSamples);

      realPower = sumP / numberOfSamples;
      apparentPower = voltageRMS * currentRMS;
      powerFactor = realPower / apparentPower;
      reactivePower = sqrt(apparentPower * apparentPower - realPower * realPower);

      last_kWhTime = kWhTime;
      kWhTime = millis();

      kiloWattHour += (realPower / 1000) * ((kWhTime - last_kWhTime) / 3600000.0);

      sumV = 0;
      sumI = 0;
      sumP = 0;
 }

void displayPower(){
   lcd.clear();
   lcd.setCursor(0,0); //col,row
   lcd.print("Voltage: ");
   lcd.print((int)voltageRMS);
   lcd.print("V  ");
   lcd.print("Current: ");
   lcd.print(currentRMS);
   lcd.print("A");
   lcd.setCursor(0,1);
   lcd.print("Power: ");
   lcd.print(realPower);
   lcd.print("W  ");
   lcd.print("pf: ");
   lcd.print(powerFactor);
   lcd.setCursor(0,2);
   lcd.print("VAR: ");
   lcd.print(reactivePower);
   lcd.print("VAR  ");
   lcd.print("VA: ");
   lcd.print(apparentPower);
   lcd.print("VA");
   lcd.setCursor(0,3);
   lcd.print("Energy used: ");
   lcd.print(kiloWattHour);
   lcd.print("KWH");
  }

void sendToCloud(){
    iotkit.send("voltage", voltageRMS);
    iotkit.send("current", currentRMS);
    iotkit.send("realpower", realPower);
    iotkit.send("powerfactor", powerFactor);
    iotkit.send("reactivepower", reactivePower);
    iotkit.send("apparentpower", apparentPower);
    iotkit.send("energy", kiloWattHour);
  }
Attachments
Step 11: Complete System
I have used plastic box as protective case for my system. You can use your own 3-D printed box. For best quality 3-D printing service you can try http://www.shapeways.com/. Here are some image of my setup
1. Cut your box according to LCD and add glue to fix LCD with the box.

2. Fixed LCD with box

3. Fixed LCD contrast adjustment circuit to box with glue
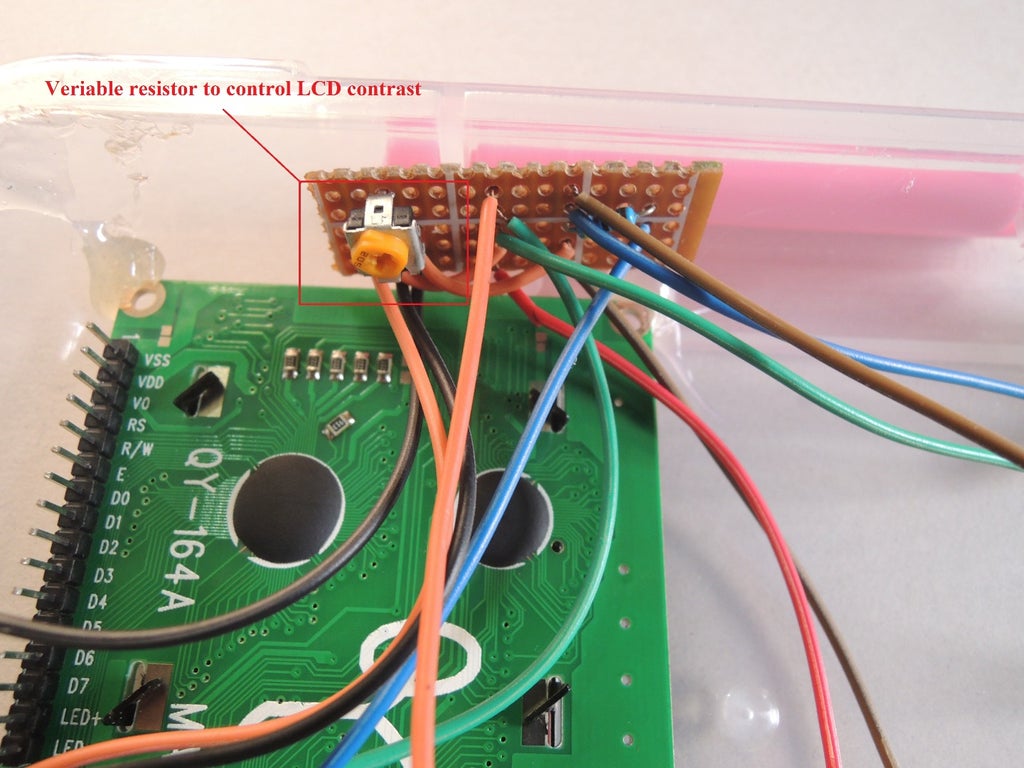
4. Fixed Current sensor and Voltage scale down circuit with box

5. Adjusted Edison to another part of box

6. Connected jumper wires to LCD

7. Connected LCD with Edison

8. Connected Load (lamp) to the current sensor. Power up the circuit and test it.

next
Step 12: Data Monitoring & Analysis From IoT Analytics Cloud
Different charts for the data uploaded from arduino to IoT Analytics are attached here. IoT Analytics shows different data in different color.
Following image shows the color for every data variables.

Following image represents line chart for all data items.

Every data item can be shown separately in a list form.


Min/Max line plot shows the minimum and maximum values of a data variable and the range.



Participated in the
Intel® IoT Invitational


