Introduction: TAM 335 Partial Lab Report 6 - Calibration of a Flowmeter


This is a guide for calibrating bulk-flow measuring devices that rely on measurements (hydraulic flow meters) of pressure change, especially the orifice-plate meter. The pressure difference induced by the orifice-plate meter is measured using a mercury height differential manometer, where the height difference reading on the manometer (∆h), and therefore the pressure difference, is zero when there is no flow. Various pressure differential measurements obtained from these manometers are used to calibrate the electrical pressure transducer (running in parallel). The electrical pressure transducer measures the pressure difference for the hydraulic flow meter by producing a correlated output voltage. A paddlewheel flowmeter (producing output voltage from flow rate) is also calibrated and used. These correlations are determined in this lab, along with analyzing their discharge coefficients.

Supplies


The F-4 apparatus at the Talbot fluids laboratory is used. This consists of the following:
- LABView software
- 4-inch diameter pipe
- Orifice plate hydraulic flowmeter
- Pressure difference transducer
- Water-mercury height differential manometer
- Paddlewheel flowmeter
- The smaller weighing tank of 400 pounds
- Stopwatch
Step 1: Calibration of the Manometer Differential Pressure Transducer


The electrical pressure transducer's output voltage is zeroed when there is no flow and no pressure difference experienced in the manometer. First, the discharge valve is closed. Then, the pressure in one line of the manometer is artificially decreased by progressively opening the manometer bleed valve (CAL VALVE). The manometer height readings and their corresponding output voltage (produced by the transducer) are recorded in LABView (6 data points including zero and maximum pressure differential). Then the LABView software graphs the data and makes a linear approximation (in this data, the linear fit was ∆h = 18.1284*V - 0.1167).
Step 2: Data Acquisition


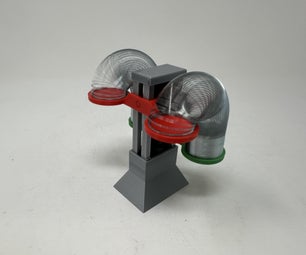
Once the transducer is calibrated, the paddlewheel flow meter is also calibrated (output voltage is zeroed at zero flow). Then the discharge valve is opened and the flow rate is set to its maximum by turning the wheel in the photo. The manometer height reading, pressure transducer voltage reading, and paddlewheel voltage reading are recorded. Note that this manometer reading is denoted as ∆hmax. A weight-time measurement is also made for the volumetric flow rate by maintaining the flow rate and using a stopwatch to measure the time to fill the tank with 1000/400 pounds of water (on the scale). More information on the weight-time method can be found in lab report 1. Also, note that this flow rate value is denoted as Qmax. The same readings are made for 10 manometer height values of (0.9)2∆hmax, (0.8)2∆hmax,(0.7)2∆hmax, ... ,(0.3)2∆hmax,(0.2)2∆hmax, and (0.1)2∆hmax. The weight-time measurement for each of these height difference values should correspond to 90%, 80%, 70%, ... , 30%, 20%, and 10% of the maximum flow rate, respectively. The weight-time measurement for flow rate (using manometer height readings) can be compared with the paddlewheel output voltage.
Attachments
Step 3: Lab Report #1

Measured flow rate Q as a function of the manometer deflection ∆h for the orifice-plate meter, representing the linear calibration curve for the flowmeter.
Step 4: Lab Report #2

Measured flow rate Q as a function of the manometer deflection ∆h for the orifice-plate meter, representing the logarithmic (base 10), alternative calibration curve for the flowmeter. This curve appears to fall on a straight line, indicating that a power-law relation of the type Q = K(h)m or Q = 0.0019(h)0.5078 applies.
Step 5: Lab Report #5


The discharge coefficient Cd as a function of the Reynolds number Re on linear–log scales.
Step 6: Lab Report #6


Actual discharge rate Q as a function of the voltage output V using weight-time measurements. This data did not have any cut-off velocities, as there is no point where the output voltage of the paddlewheel is 0 volts or the flow rate is 0 m3/s. However, the lowest velocity calculated is 0.633 m/s. The maximum fluid velocity achieved in this data is 3.254 m/s.
Step 7: Question #2


The discharge coefficient Cd has a relatively constant value of 0.60 over the range of Reynold numbers tested, however, the experimentally measured values of Cd are not close to the ideal value of unity (along the contraction ratio beta = 0.5 curve). Even taking the average of The discharge coefficient and Reynolds number produces a data point on the beta = 0.4 curve. Although more data may provide a more precise calculation of Cd, the equation used to calculate the discharge coefficient takes into account the contraction ratio, but not the velocity coefficient CV and area contraction coefficient Cc. More specifically, the loss of energy due to turbulence and flow separation from the orifice geometry is not accounted for in the original equation. The sharp geometry causes the flow near the downstream pressure manometer to have a lower flow diameter; the turbulent stream (vena contracta) can be accounted for using the velocity coefficient. Also, the downstream pressure manometer is at a different diameter than the orifice diameter d, causing the discharge coefficient to be deflated compared to its actual value. The area contraction coefficient accounts for this.
Step 8: Question #4
The paddlewheel flow meter was reliable for this data. However, for extreme flow rates (very high or very low), the flow may not be accurately reflected upon the output voltage. For lower flow rates, the paddle may not move, while for high flow rates, the turbulent flow and frictional forces may affect the accuracy of the voltage output. These discrepancies were not reflected in this experimental data.