Introduction: TAM 335 - Lab 6 - Calibration of a Flowmeter Instructable for New Hire

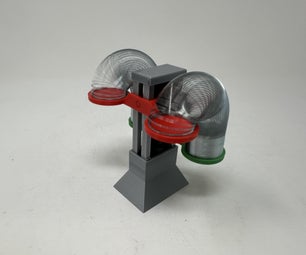
Welcome to the calibration process for bulk-flow measuring devices that rely on pressure change measurements, such as Venturi meters, paddlewheel flowmeters and orifice-plate flowmeters. Your primary objective is to calibrate these 3 flowmeters following the steps outlined below. The above image details the laboratory set up with flowmeters. Once we obtain data for each of the 3 flowmeters we can begin to determine which is most effective in our experimental case by seeing if there is an established monotonic relationship between flow magnitude and the device's output.
Step 1: Getting Started

Beginning with calibration it is imperative to ensure procedures are set in place and followed properly. Let's begin by checking that the discharge valve is shut so that no flooding occurs, and also checking the mercury levels in the manometer are even so that there is no initial pressure difference present in no flow conditions. The figures above show the Venturi meter and Orifice-plate flowmeter.
Step 2: Calibration of the Manometer Differential Pressure Transducer
Okay, let's start by calibrating the Validyne transducer labeled as VFn (where 'n' is the pipe number) used to measure pressure differences. This calibration is done no flow to ensure accuracy. Zero out the transducer's output using the VFn interface box located next to the computer. This step sets a baseline reference point. Close the discharge valve, and then open a valve on the manometer labeled "CAL VALVE" to lower the pressure in one of the manometer lines artificially. Then simply record both the transducer's output (in volts) and the manometer levels (in centimeters) using LabVIEW software. You will collect data at five points, ranging from no pressure differential to the maximum possible pressure differential with the bleed valve fully open. The LabVIEW program will perform a linear least-squares analysis on the data you've collected, and calculate and store the slope and intercept of the resulting line. You'll use this data later for further measurements! Finally, close the "CAL VALVE."
Step 3: Paddlewheel Flowmeter and Orifice-Plate Flowmeter
Then we move onto the paddlewheel and orifice-plate flowmeter. Begin by setting the Gain Adjust control for the paddlewheel flowmeter to 6.25 turns for P1 and P4, and 3.00 turns for P3. Zero the paddlewheel flowmeter using the Zero Adjust control. Gradually open the discharge valve to allow a steady flow, and record Validyne pressure voltage and paddlewheel voltage readings when the paddlewheel shows a significant nonzero value. Collect data for time-averaged pressure-transducer voltages, manometer readings, paddlewheel flowmeter readings, and weight-time measurements when the flow reaches its maximum.
Step 4: Rinse and Repeat
Repeat the data collection process for slower flow rates based on lower multiples of the maximum height recorded earlier. After obtaining data from 10 measurements, use LabVIEW software to calculate the flow coefficient. Additionally, compare the outputs of the paddlewheel flowmeter with the flow rates measured by the weight-time method for each height deflection used. We'll consolidate this data by running it in Excel to compare flow rate with our measurements.
Step 5: Analysis: Flow Rate and Manometer Deflection

Let's begin this step by analyzing our collected delta h from the Venturi and orifice-plate flowmeter to see its influence on the volumetric flow rate (Q). As we can see, plotting in linear scale (no logarithmic scale applied), the plot shows a slight curve.
Step 6: Analysis: Flow Rate and Manometer Deflection (logarithmic)

Next we can further analyze this relationship by appending the scaling for both flow rate and deflection by logarithmic scale. When we apply these changes, a starkly linear formation appears on the graph, much more so than the linear plotting method. Because the data does appear to fall along a straight line, so we could make the assumption that the power law relation Q = K(∆h)^m would apply.
Step 7: Analysis: Discharge Coefficient Versus Reynolds Number


Let's take a look at the discharge coefficient Cd in relation to the Reynolds number values collected. As we can see the relationship is nearly constant but has a wider margin of error at lower Reynolds numbers. Recall that an ideal Cd is =1 theoretically. Of course in experimental settings with non perfect conditions this is typically not the case, but values can still be quite high as shown in the figures above showing ISO discharge coefficient curves for Venturi and orifice-plate flowmeters, with Venturi being slightly more consistent in value.
Step 8: Analysis: Flow Rate and Paddlewheel Voltage

The relationship between paddlewheel voltage and volumetric flow rate is demonstrably linear here. Thus, we can calculate cutoff fluid velocities using the equation Q = V*A. Taking the area of the flowmeter entrance as 102.3 mm given in Table 1 above, we get A = pi* (.1023/2)^2 , and thus the velocities are 0.202 m/s and 2.07 m/s. The maximum fluid velocity would correspond with highest flow rate Q, meaning the maximum fluid velocity achieved is 2.07 m/s.
Step 9: Discussion

The data collected effectively demonstrates experimentally derived calibration calculations of 3 flowmeters: Venturi meters, paddlewheel flowmeters and orifice-plate flowmeters. Given the most linear relationship among paddlewheel flowmeters, they seem the most useful in conducting calibrations, but conducting further experiments with more data and perhaps a wider range of flow rates would be useful in ensuring this is the case.
The discharge coefficient Cd is essentially constant over the range of Reynolds numbers tested. The experimentally measured values for Cd are not close to the ideal value of unity derived theoretically, and this could be attributed to many experimental measures in the measurement process. This is to be expected as theoretical values might not account for the friction, turbulence, and random flow rate differences that can happen in the tube. We see a slight trend upwards at higher flow rates, so perhaps testing faster flow rates would correct the error seen more prominently at lower flow rates.
The paddlewheel flowmeter is reliable, because of the linear relationship we observed between flow rate and paddlewheel voltage. It would be more accurate and higher flowrates because if the pipe was not fully filled with water, there might be differences in flow reading based on where the water is hitting the paddle. Therefore, a full pipe of water flow would be ensured at higher flowrates to minimize error.