Introduction: Finding North and Time by Stars in the Tropics
by tonytran2015 (Melbourne, Australia).
This posting gives a method of using stars in the tropics under adverse effects of high skyline and bright sky. It is applicable whenever more than 30% of the night sky is seen.
It is based on the traditional tropical Oriental country methods, with the added improvement by using accurate data on dates and angular distances between stars for their identification. It is useful when the sky is unclear and restricted such as in cities with high skyline and bright sky.
Step 1: Identifying Bright Stars in the Tropics.
Figure: Table of 20 brightest stars plus two additional easily identifiable stars for navigation in the tropics.
People in the tropics learned using stars differently from people in the temperate zones.
In the tropics it is difficult to see the polar and circumpolar stars to start identifying stars. Traditional (not influenced by Western astronomical knowledge) country methods by tropical people ignore the polar stars and rely on the dates of tropical stars and their order of succession in the sky to identify them.
Any tropical star is visible nightly (either from Sunset to its setting or from its rising to Sunrise) for more than 10 months each year. The visibility cycle for each star begins with the star seen rising near the Eastern horizon few minutes before Sunrise. On subsequent days, the star rises earlier and earlier, it travels gradually towards the West and remains for longer and longer duration in the night sky until one day it stays for the whole night. The star is therefore called a star of that date. After that day, the star is seen setting in the West in the night. On subsequent days, its lead on the Sun gradually increases and it sets on the West at earlier and earlier time. Near the end of the cycle, the star is visible above the Western horizon for only few minutes after Sunset. It then sets on the West. At the end of this cycle, the star is too close to the Sun to be visible in the sky. The cycle then repeats from the beginning.
The table of this step shows the stars in their order of appearance in the year. The date of a star is the night when the star attains its highest elevation at mid-night (when the hidden Sun has the most negative elevation) and it is visible for that whole night.
Step 2: Identifying Stars Positively Using Patterns in the Map.
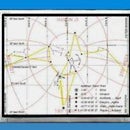
Figure 1: Mercator map, for upside down reading, of the central strip of the night sky. An observer looking up will see that the continuous strip made up of this map and its identical copies slowly moves from its left (aligned to rise on the East of the sky line) to its right (aligned to set on the West of the sky line). Figures 2, 3, 4, 5: Reading the Mercator map with a grid of azimuth and elevation lines.
The bright stars for the date near to the current date are then joined to its neighbours of similar brightness to reveal their relative directions and distances. These directions and distances form shapes and sizes to positively identify the stars.
As only the 20 brightest stars are used with large unique patterns in the sky, there is no possibility of having two similar patterns with equal sizes. A user of this method matches the observed shapes in the sky and compare them with those given in the map to identify stars positively.
The map of this step (for upside down reading) shows the stars in a central strip of 120 degree width going across the sky starting from the Eastern horizon and ending at the Western horizon. An observer lying on his back, looking upwards vertically will see a part of a long continuous strip made up of the map in this step joined by its identical copies slowly rises from the Eastern horizon, moves across the sky (the right hand side of the map leads, left hand side trails) then sets on the Western horizon. He can only see those stars of this map within a window of 12 hours width (in the direction of left to right on the map) when there is no sunlight. The window remains stationary while the continuous strip, being the map here followed by its identical copies, moves across the sky (the right hand side of the map leads and left hand side trails). This is illustrated in the four approximate zenithal maps of the tropical mid-nights to be found at the end of this section.
The users of this method should keep in their minds that some bright planets (especially the outer planets Mars, Jupiter, Saturn) may wander on the ecliptic (drawn on the map) and cross some area under observation to confuse the identification of stars and constellations. The positions of those such slowly moving bright planets should be noted when observation condition is favourable.
Example:
For May 15th, the star to use is Antares (of May 29th) in the Scopii. The nearby stars to use are
Spica (201.3 deg R.A., -11.1 deg decl.),
Arcturus (213.9 deg R.A., +19.2 deg decl.),
Antares (247.3 deg R.A., -26.4 deg decl.),
Vega (279.2 deg R.A., +38.8 deg decl.).
Step 3: Mercator Maps and the Distances on Them.
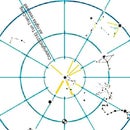
Figures: Approximate zenithal maps of the tropical midnight sky for December 21st, March 21st, June 21st and September 23rd. Positions of stars near the horizon are not accurate in these maps. The maps are obtained by placing circular windows of 12h width on the Mercator map.
The map in the preceeding step uses a Mercator projection to preserve angles.This projection specifies that
(Vertical distance to equator on Mercator map)/(dist. to equator by rectilinear scale) =
(180deg/3.14159rad) × ln((1+tan(0.5×decl.))/(1-tan(0.5×decl.))) / declination.
The projection makes small shapes look similar to the original shapes on the Celestial sphere. Equatorial shapes on the Celestial sphere are faithfully represented. However shapes near the polar regions of the Celestial sphere are enormously overstretched by this type of maps. The distortion can be easily seen by comparing the Mercator map given here and the two polar maps given in reference [2].
The equator line of a Mercator map can be used as a scale to measure distances between stars near to the equator. The vertical lines for of Right Ascension divides it into hours. Each hour of R.A. corresponds to 15 degrees on the Equator line.
The distance between two close stars anywhere on the map is their distance measured on the map multiplied by the cosine of the declination angle of their midpoint.
When the two stars are widely separated, the great circle arc joining them is divided into (about 3) small segments and their distances are added together to give the total distance.
Example:
The distance between Sirius and Canopus on the map of step 2 is measured (using the equator line as a scale) to be nearly 47 degrees in length.
Their midpoint is nearly at 40 degrees (in absolute value) in declination.
Their great circle distance on the Celestial sphere is therefore nearly
47deg X cos(40deg) =36 deg.
This is reasonably close to the actual distance of 36 degrees deduced from the values obtain from their declination and R.A. values given in the table of step 1.
Step 4: Measuring the Angle Between Any Two Stars.
The actual angular distance between any two stars in the sky can be measured using a compass divider with each leg pointing to a star and their angle measured on a protractor.
The two legs of the compass divider can be substituted by two stretched fingers on one hand. The protractor can be substituted by a 12h clock face with each hour marking representing 30 degree angle separation.
(Instrumental navigators use sextants for highly accurate measurements of angles between stars and they can quickly decide on the identity of stars.)
Step 5: Finding Time With Stars.
On its date, a star reaches its meridian at midnight. Every month before/after that the star reaches its meridian plane two hours later/earlier.
The user of the method should add the difference between zonal time and local time (when noon is at 12am) to obtain the zonal time.
Step 6: Conclusions.
1/- I have tested this method in Saigon, a city with unclear sky and high-rise buildings and found it to be applicable in 80% of the non-rainy nights.
2/- Users of this method should take care not to mistake planets for dimmer stars along the ecliptic.
References.
[1]. tonytran2015, Finding North direction and time by any bright star, Instructables, https://www.instructables.com/id/Finding-North-Dire..., posted on Apr 14, 2016.
[2]. tonytran2015, Finding North direction and time by stars, Instructables, https://www.instructables.com/id/Find-North-directi... ,posted on Jul 24, 2015.


